In the world of energy trading, not all pricing tools are created equal. Two commonly used benchmarks— WTI Futures Contracts and WTI Calendar Month Average (CMA) Contracts, serve different purposes and appeal to different types of traders and hedgers.
Most oil producers’ pricing formulas are based on the NYMEX WTI Calendar Month Average (CMA) contract. However, the WTI price commonly quoted in the media is the front-month futures price, an exchange-traded instrument accessible to speculators and investors. Although CMA pricing is derived from the futures curve, extreme price moves can create temporary dislocations between the two.
A Real-World Example
A recent dislocation occurred in June during the early stages of the Israel–Iran conflict. Oil prices spiked due to rising geopolitical risk, but the increase was concentrated at the front of the futures curve. Near-term futures prices rose more than longer-dated contracts, resulting in steepened backwardation.
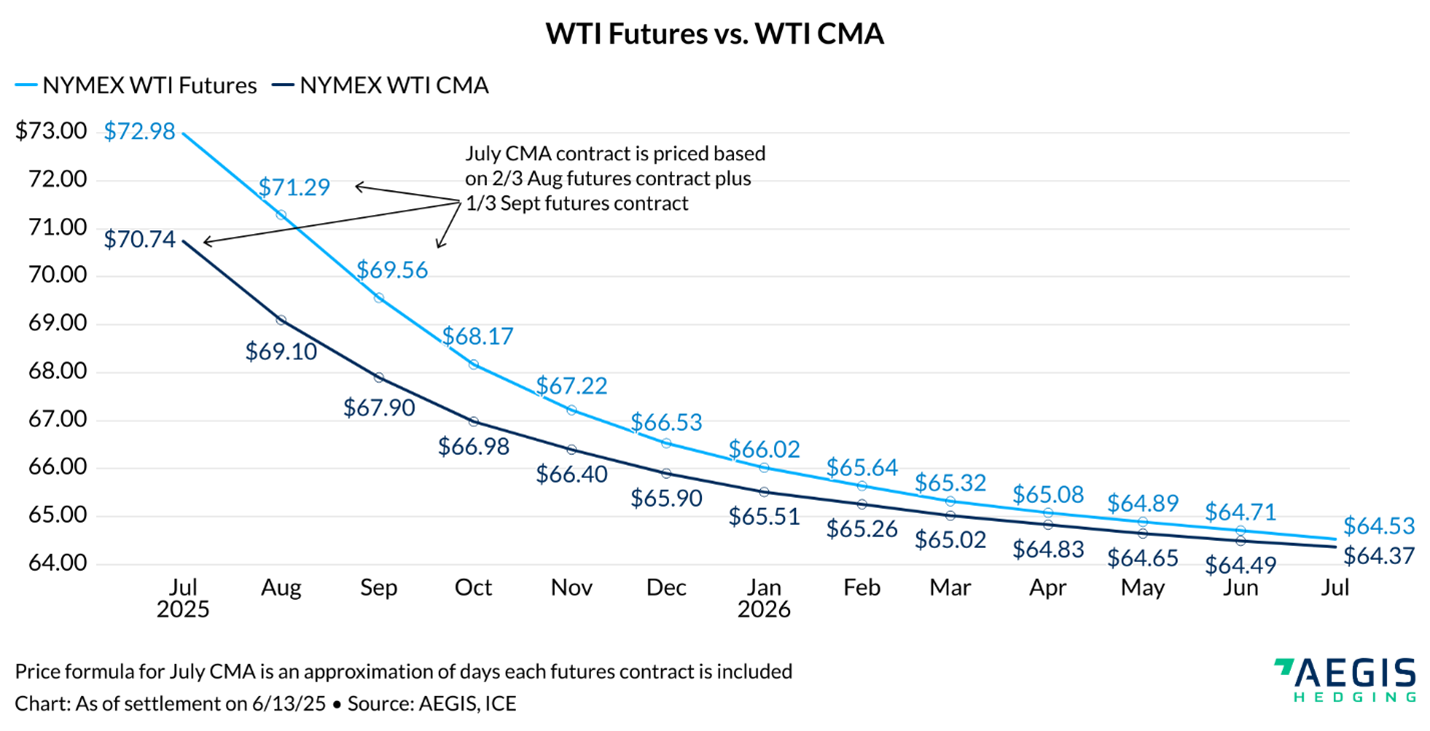
As a result, the front-month WTI futures contract outperformed the corresponding WTI CMA contract. The chart below illustrates this divergence.
Why the Difference?
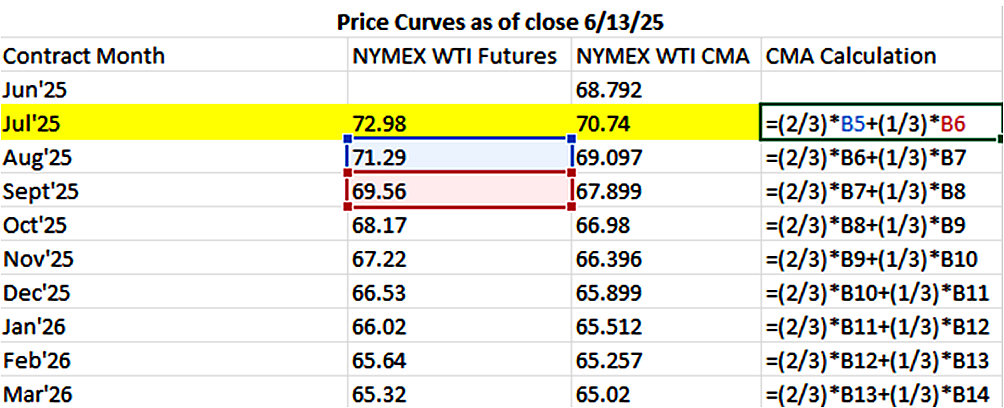
The CMA price is calculated as an average of the daily settlements of futures contracts that will be prompt during the physical delivery month—one and two months forward.
For example, on June 13 (the first business day after Israeli strikes), the prompt futures contract was July. However, the July CMA price is based on the average of the August and September futures contracts, as those will be prompt during July.
This structure means that CMA pricing tends to lag short-term rallies or declines. Here’s how the difference played out:
|
Contract Type |
Price (June 13) |
|
July '25 WTI Futures |
$72.98 |
|
July '25 WTI CMA |
$70.74 |
How the Contracts Differ
Understanding the distinction between these contracts is critical for managing physical pricing exposure. Below is a breakdown:
WTI Futures Contracts
WTI CMA Contracts
A side-by-side comparison between the two contracts is below.
|
Feature |
Futures Contract |
CMA Contract |
|
Contract Unit Size |
1,000 Bbl |
Customizable |
|
Trading Availability |
NYMEX/CME Exchange |
Over the Counter (OTC) and typically do not require margin |
|
Counterparty |
Unknown |
Known |
|
Termination of Trading |
Trading terminates 3 business days before the 25th calendar day of the month before the delivery month. If the 25th falls on a weekend or holiday, this cut-off shifts to 4 business days before |
Last business day of the contract month |
|
Settlement Price Calculation |
On the day of expiration, the expiring month will settle based on the VWAP of the outright CME Globex trades executed between 14:00:00 and 14:30:00 ET |
The arithmetic average of the NYMEX WTI Crude Oil futures first nearby contract settlement price for each business day that it is determined during the contract month |
|
Settlement Procedure |
Physical Delivery |
Cash Settlement |
Knowing which contract underpins your physical pricing is essential. CMA contracts, not futures, are almost always the basis for oil producers' pricing formulas. While both instruments are linked, understanding their differences can help you better navigate risk and market volatility.
If you have questions or want to discuss your specific physical contract structure, our team is happy to help.