After ending winter ‘24/’25 well-below the five-year average, Lower-48 natural gas storage levels have climbed very swiftly this summer. This has weighed on both near-term gas prices and the forward strips, with the Winter ‘25/’26 seasonal strip falling more than $1 from the June peak of $4.88/MMbtu. While weaker year-over-year power sector gas demand has contributed, persistently strong supply is one of the primary drivers.
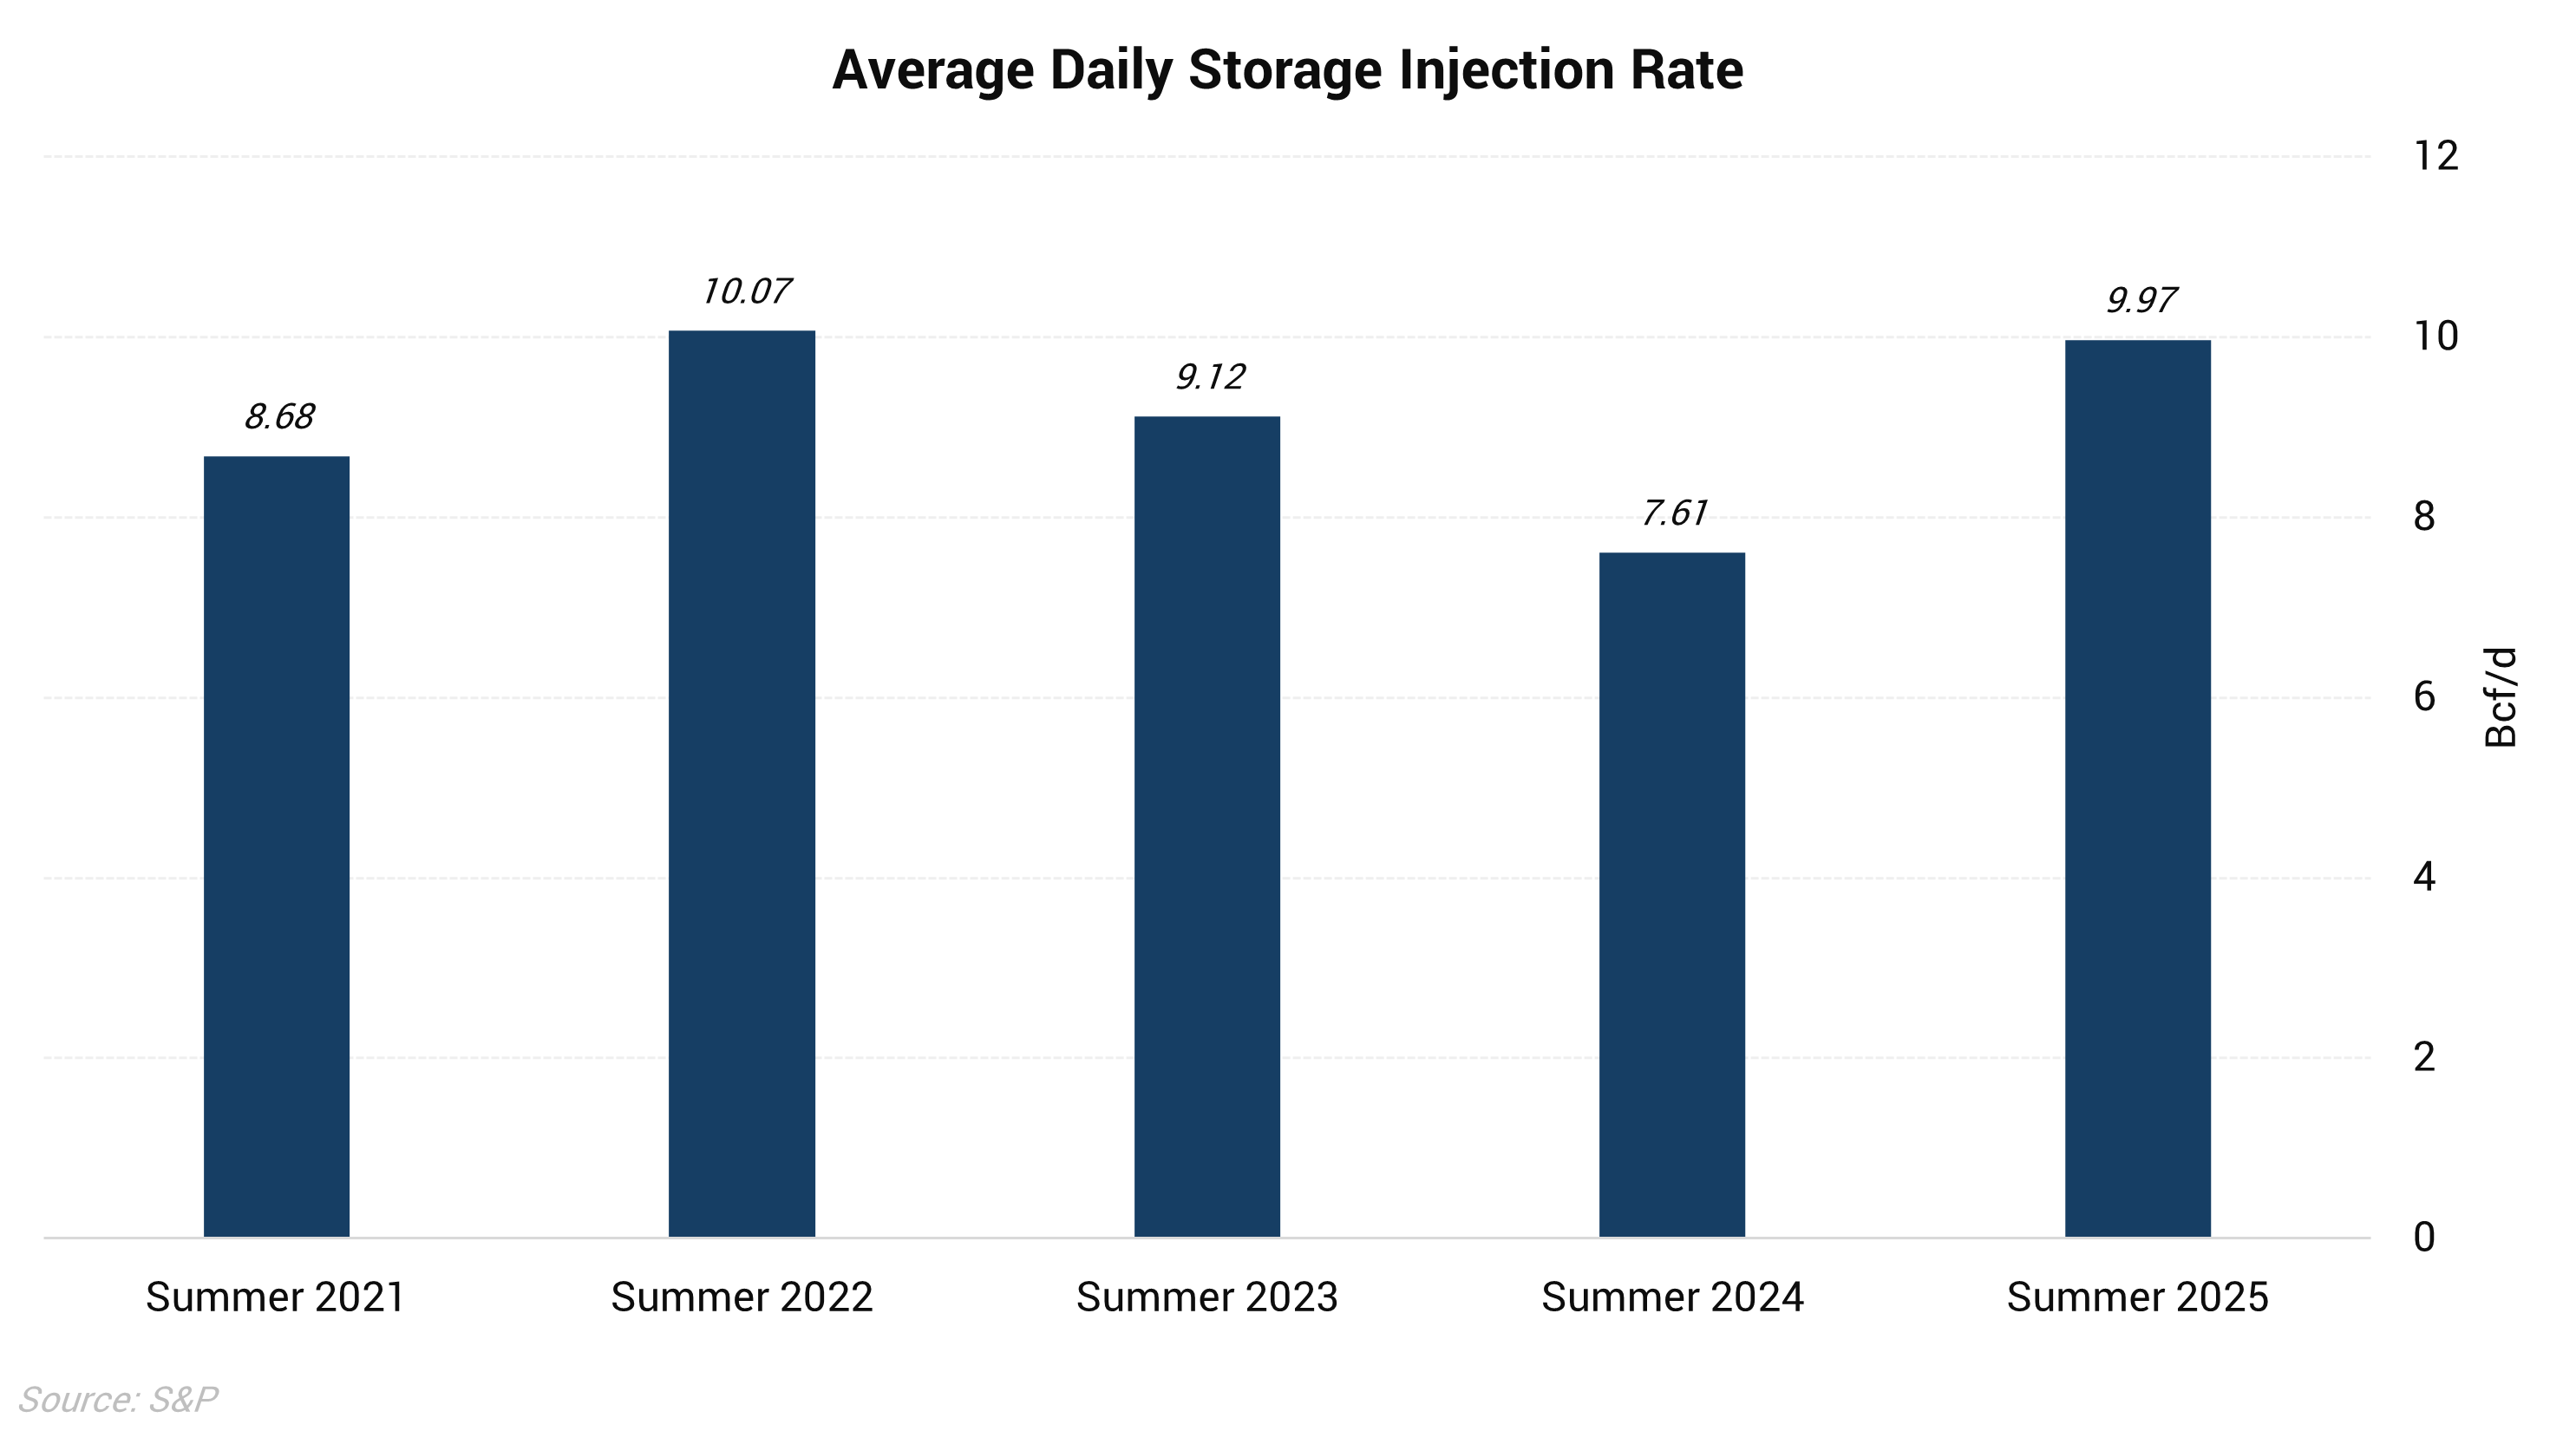
The chart above shows the average daily storage injection rate over the past four summers, and the average rate of injections so far in Summer ’25. Storage builds have averaged almost 10 Bcf/d this summer, more than 2 Bcf/d higher than last summer. This summer is almost the highest rate of the past several years, with only 2022 being higher. Price has a lot to do with this, as last summer prompt gas prices were at multi-year lows and storage was already above average to start summer. When further breaking down the year-over-year changes in fundamentals it becomes clearer why storage has built so quickly this summer compared to 2024.
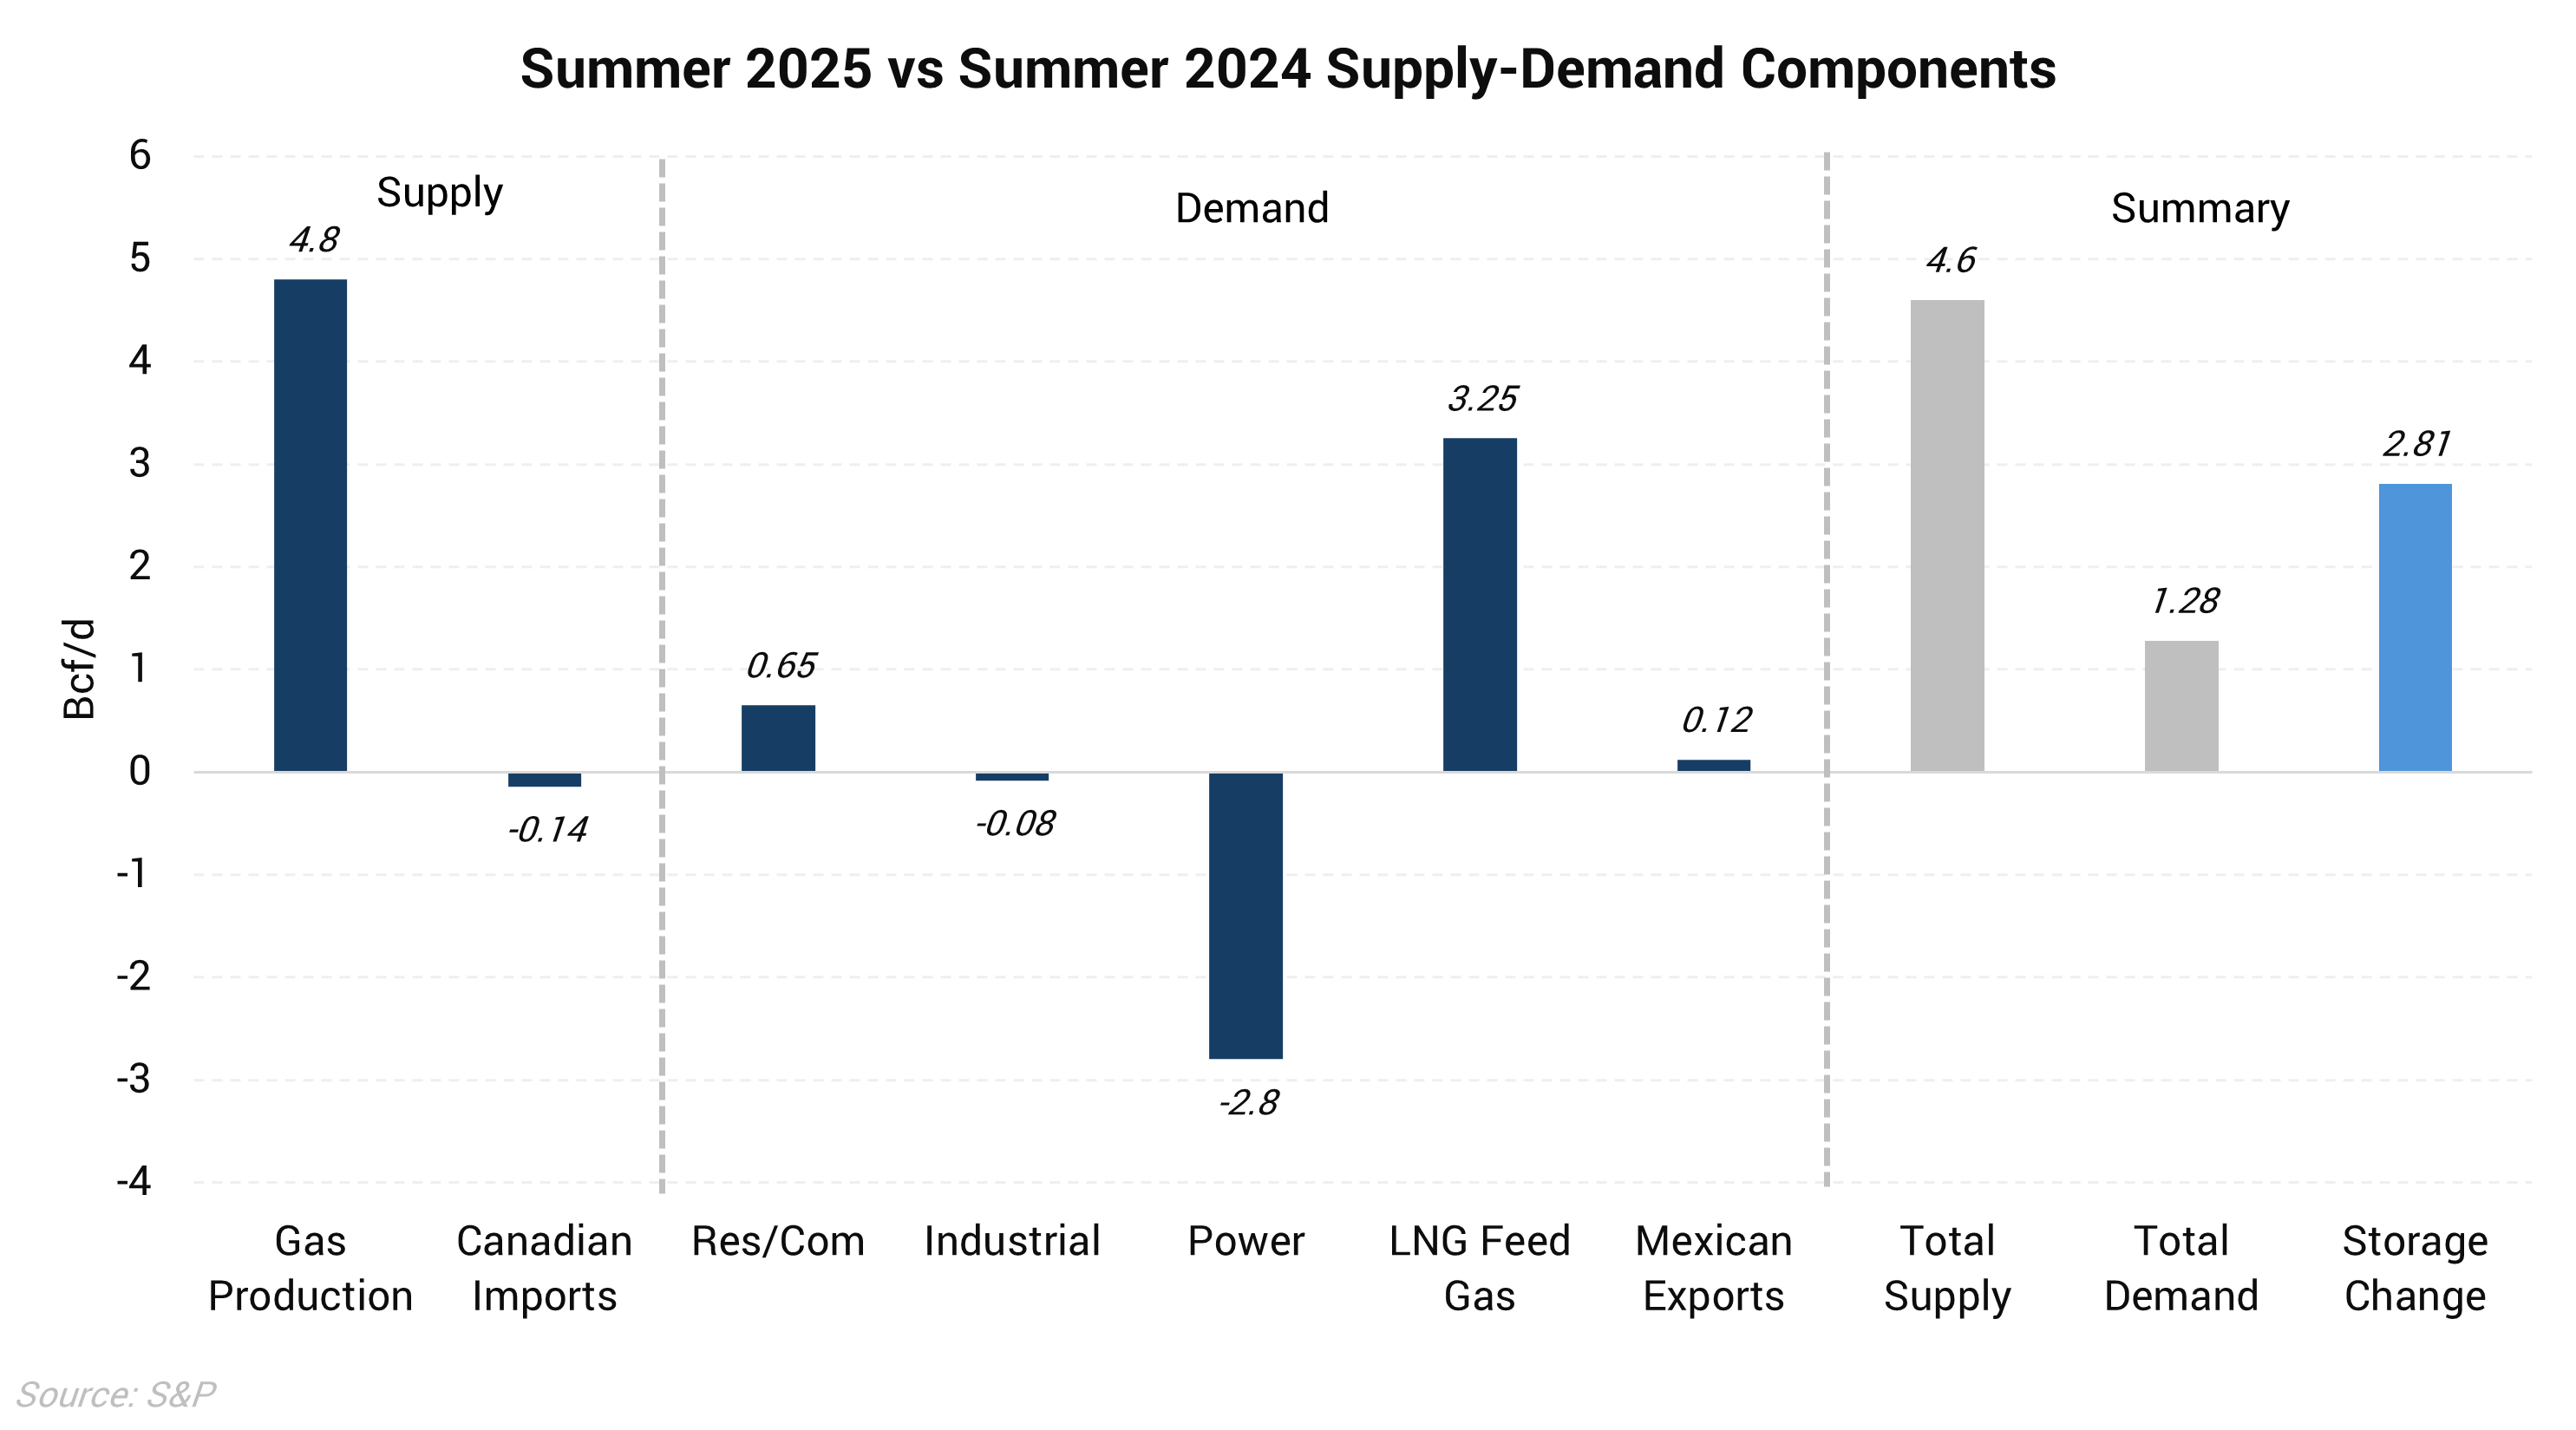
The chart above shows the change in average daily supply-demand components this summer compared to summer 2024. Despite the -2.8 Bcf/d year-over-year decline in power burn, total demand has actually increased, driven by LNG feedgas. However, this 1.28 Bcf/d increase in demand is swamped by the 4.6 Bcf/d increase in supply. This mismatch has resulted in storage injections exceeding last summer’s rates by 2.81 Bcf/d. If this summer was not as mild as it has been and weather had been normal, power burn would be higher, but likely still negatively impacted by a combination of more renewable generation and higher gas prices encouraging higher coal consumption.
This dynamic has resulted in higher expectations for inventories to start winter, with our modeling showing storage approaching the top of the five-year range this November. Due to this, it makes sense that forward prices for this winter have suffered so much over the past few months.