- WTI CMA Roll hinges on the direction of the NYMEX WTI forward curve, which reflects the market's expectations about future oil prices
- The Roll represents a time spread for piped barrels between when they are nominated and when they are delivered
The WTI Calendar Month Average Roll, also known as "the Roll," plays a key role in the pricing formulas used by oil producers and can be hedged against price fluctuations. It's calculated for a specific month by taking the daily average of 2/3 * (Month 1 Future — Month 2 Future) +1/3 * (Month 1 Future — Month 3 Future) for each trading day in the associated Trade Month Period.
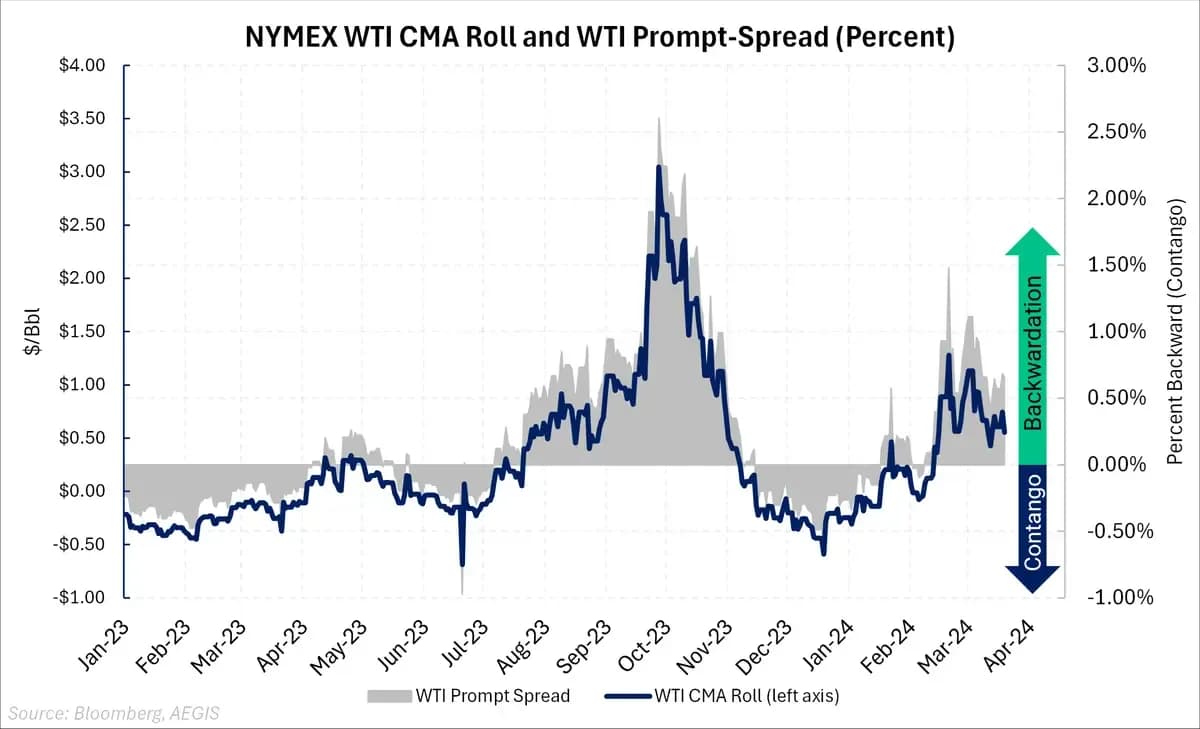
The Roll has a direct impact on pricing, acting as a contributor when the WTI futures curve is in backwardation (downward sloping) and serving as a detrimental factor when the curve is in contango (upward sloping ). The chart below shows how the WTI CMA roll correlates to the movements in the WTI prompt spread (Month 1 Future — Month 2 Future).
Since January 2023, the Roll trades range-bound (-$1 to +$1) and is not a large contributor to realized producer oil pricing. However, there are exceptions, such as in May 2020 when WTI prices plummeted to -$37.63 and the Roll settled at nearly -$8. Similarly, during 2H 2023, WTI prices rallied to nearly $95/Bbl, and with backwardation reaching 2.5%—the highest level since July 2022—the Roll surged to nearly $3.
Additionally, as the WTI forward curve is in backwardation today, forward WTI CMA Roll prices are also trading higher.
Furthermore, late last month, the prompt spread for WTI hit its highest level since October 2023. The first-month versus second-month WTI spread touched +1.14/Bbl on Feb. 20 and is still trading above $1 as of Mar. 19. A steeper or more backwardated curve signals tightness in the market, and this encourages withdrawals from storage.
AEGIS maintains a bullish outlook on the curve, predicated on OPEC+'s ongoing efforts to support the market. OPEC+ has started implementing its 2.2 MMBbl/d production cuts through June 2024, and there is a general consensus among analysts that the cartel could extend its curbs through December. In that case, OECD inventories, which represent nearly 50% of global crude oil stocks, could be withdrawn more, making the market materially tighter. And the Roll, like the underlying WTI, tends to increase in value in times of undersupply and further backwardation.