Have you ever asked that question? How good or bad is the costless collar I just priced? We have a way of providing historical reference when it comes to option skew.
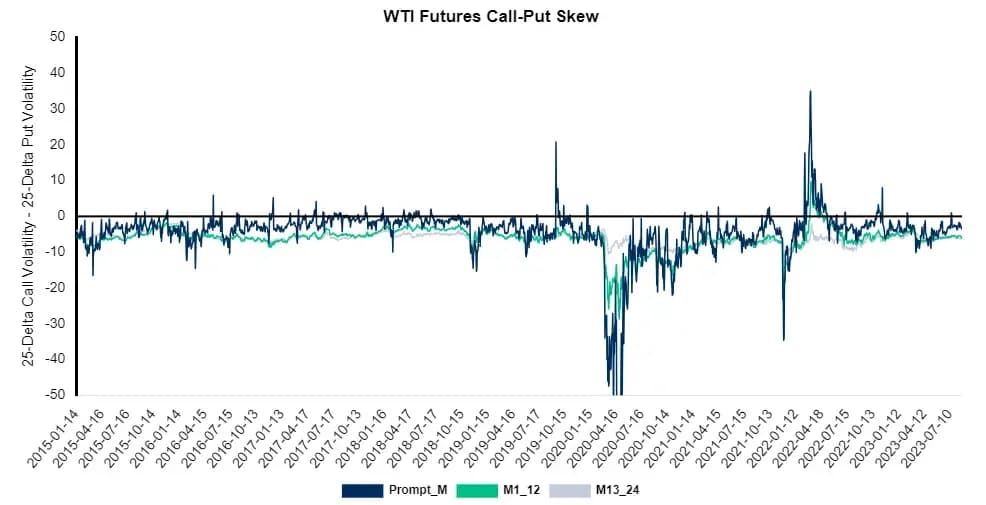
The chart below shows the relative value of call options and put options measured at the 25-Delta. If a put option commands a higher premium than the comparable call option, the line on the chart will reside below the “0” line. As the chart shows, most of the time, WTI is in put-skew. A market in put-skew can mean that a producer will sacrifice more upside participation compared to the downside protection received.
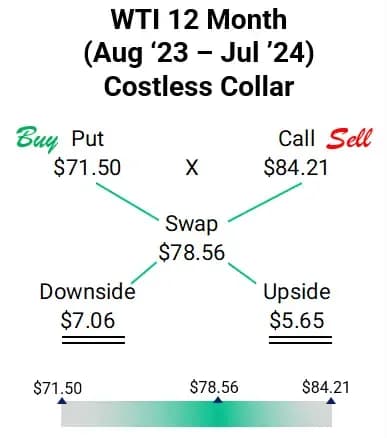
For example, on August 1, 2023, one sample 12-month WTI CMA costless collar (mid) was $71.50 x $84.21 at a time when the reference swap was $78.56/Bbl. A producer executing this structure would have to strike a put at $7.06 below the market swap of $78.56 but receive a smaller $5.65 of upside participation. Notice the imbalance, the asymmetric dollar amounts from the swap show put-skew.
But is this a good value? Or bad value? Or normal? In historical terms, this amount of put-skew, represented by the example above, is “normal” for WTI.
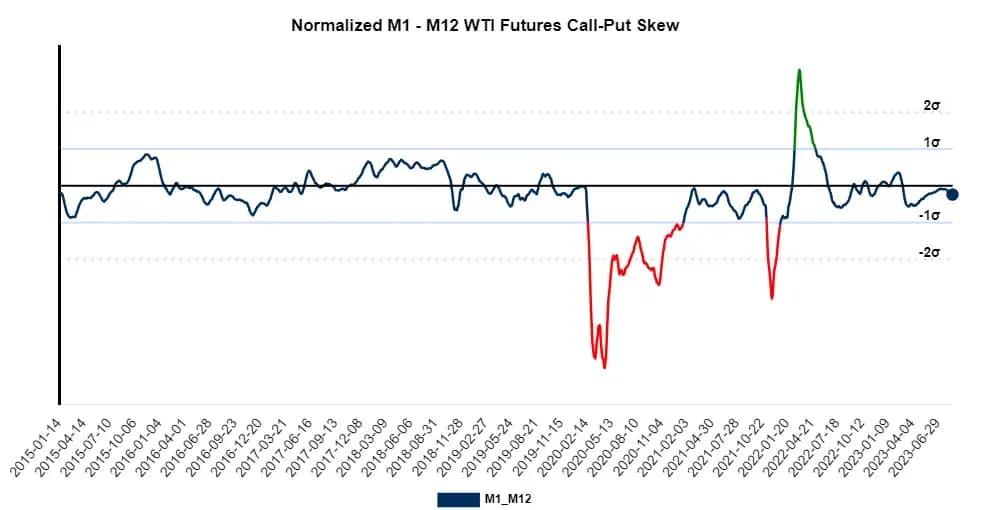
The answer of “normal” comes from the chart below. We normalize the WTI option skew to give us a simple indicator of the crude options market. When we look at where the next 12 months of WTI skew lies, we see it’s about normal (meaning that there is normal put-skew). The blue dot on the right indicates where the current option skew stands. With the dot right at the normalized zero line, we conclude that option skew in WTI for months 1-12 is normal.
The red lines on the chart show times when put-skew was so severe that a producer should be wary of put options and collars (or mitigate them using other option combinations). The green lines show times when call options were valued much higher than comparable put options. Those were times when collars were especially worth considering.
How can this chart be used?
- Provide a skew reference for costless collar indications.
- A quick indicator of which way the commodity’s options are skewed.
- Help identify times of significant variance in skew.
How not to use this chart
- Sole determination of whether to utilize a collar. Just because skew may not be the best doesn’t mean the collar is undesirable.
- Just because skew may not be the best doesn’t mean the collar is undesirable.
- Just because skew may not be the best doesn’t mean the collar is undesirable.
Reach out to your AEGIS strategist/trader for normalized skew charts or if you have any questions. Trade@AEGIS-hedging.com