To quickly access the page content, please click on the links below:
News Update
- California considers larger 2025 step-downs, sustainability guardrails, and biofuel limits. CARB held a workshop on April 10, 2024, which modeled 7% and 9% step-downs for 2025 compared to the originally proposed 5% stepdown, while maintaining a 2030 target reduction of 30%. The more stringent targets are aimed at managing a record supply of unused credits, which will continue to grow well into 2025. CARB maintained a 30% reduction target for 2030 and 90% target for 2045 at its April 10 public workshop, unchanged from the board’s December 2023 proposal. CARB also modeled a scenario in which the auto-acceleration mechanism was triggered twice, resulting in a drawdown of 170MM credits. CARB is considering sustainability guardrails as well as requiring an independent feedstock certification process. Stakeholders urged CARB to pursue the most aggressive 9% stepdown and displayed a preference for the program to be managed through more precise targets, relying less on the AAM for ease of planning and to drive investment.
- EIA Trims 2024 & 2025 Renewable Diesel Production and Consumption Forecast. EIA trimmed its 2024 and 2025 forecasts for domestic RD output and demand. US RD production for 2024 was cut by 1% to 2016 Bbl/d, according to the latest Short-Term Energy Outlook. Production for 2025 was trimmed by 0.3% to 289,000 Bbl/d. EIA cut its 2024 RD consumption forecast by 1.2% to 239,000 Bbl/d, while the 2025 outlook was trimmed 0.3% to 305,000 Bbl/d. EIA expects 2024 net exports of 25,000 Bbl/d, up 1.2% from the previous month’s STEO. Net exports for 2025 were raised 6.3% to 17,000 Bbl/d. Biodiesel production is set to average 99,000 Bbl/d in 2024 and 88,000 Bbl/d in 2025 against consumption forecasts of 106,000 Bbl/d and 83,000 Bbl/d, respectively.
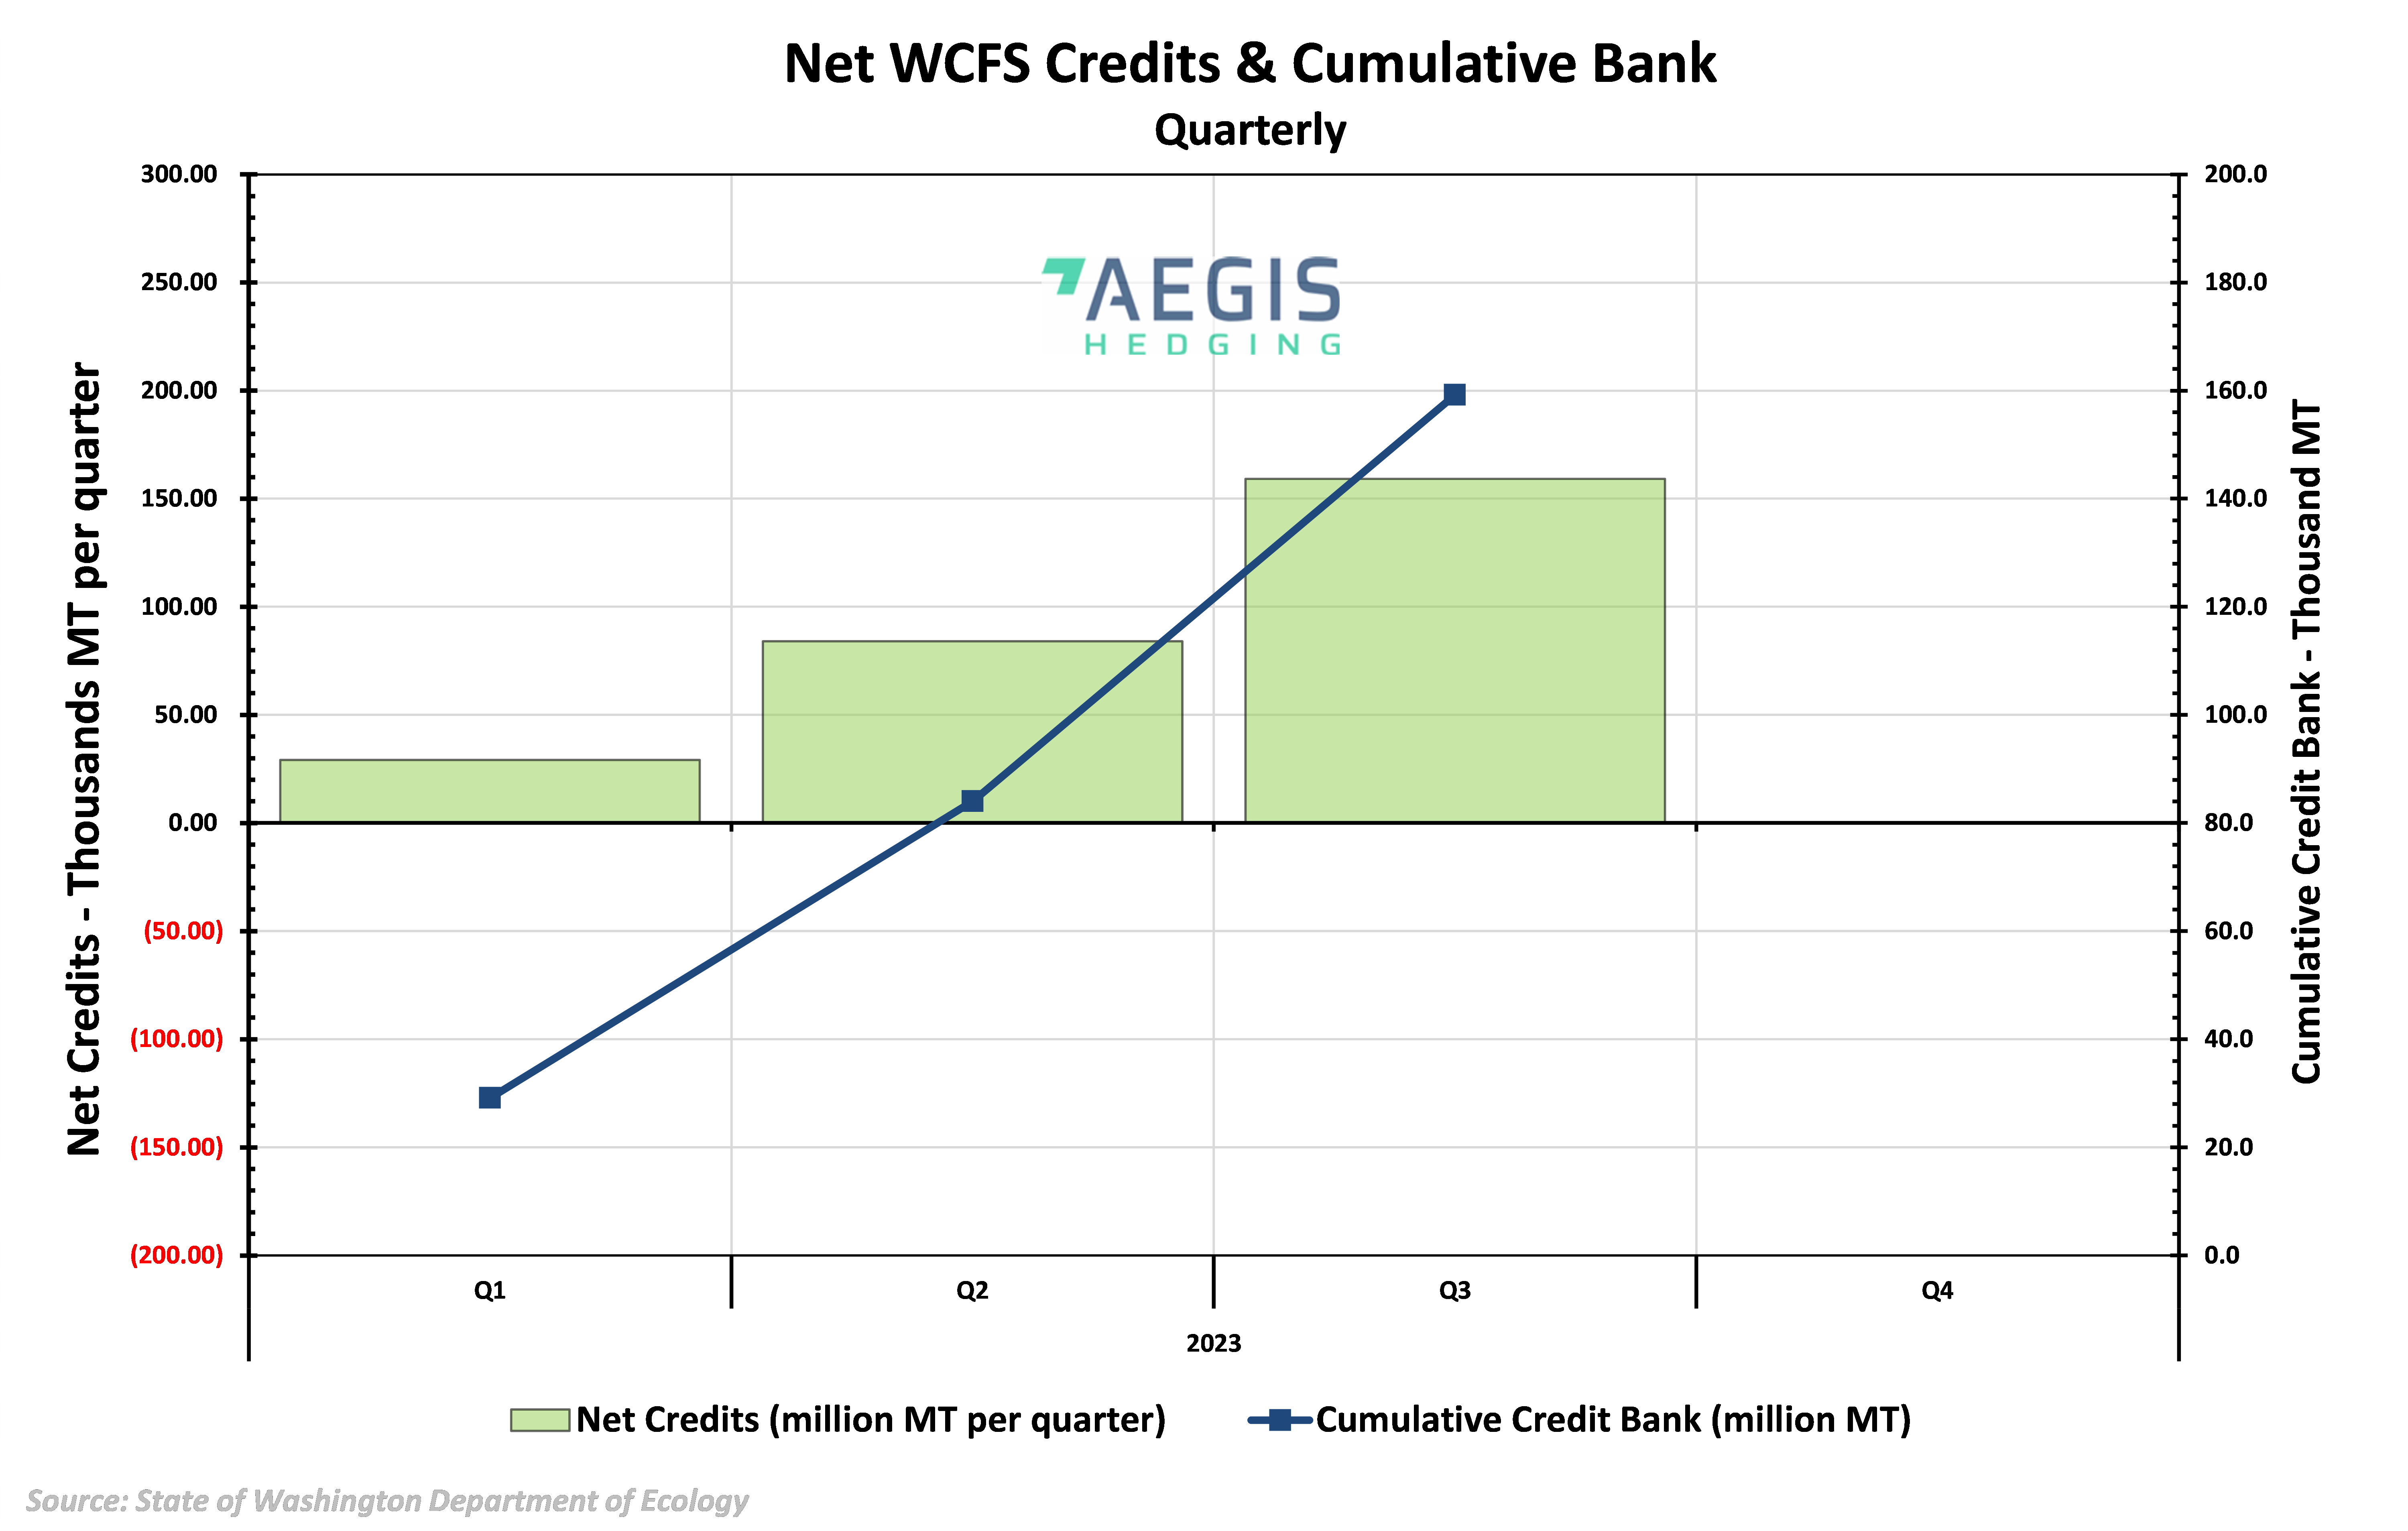
- Washington Clean Fuel Standard Posts Third Consecutive Net Credit Surplus for Q3 2023. A total of 383,926 WCFS credits were generated during the third quarter of 2023, with corn-based ethanol accounting for 40% of the total, down from 57% the previous quarter. Renewable diesel made up nearly 85% of total credit generation, up from 22% the previous quarter. The state took an additional 8.5MM gallons of renewable diesel during the third quarter, up 76% from the previous quarter. Biodiesel accounted for 9% of total credits, up from less than 5% in the second quarter of 2023. Deficits fell by 1.9% from the second quarter to 224,749, with significant declines in ethanol deficits offsetting gains in deficits from diesel and gasoline. The average CI value for renewable diesel fell just 0.18pt to 48.99 after tumbling 15.43pt the previous quarter. The average CI score for ethanol slumped 4.07pt, or 5.5% to 70.24. The biodiesel average CI rose 2.54pt to 55.35 for Q3 2023.
- GREET guidance delayed by weeks. GREET guidance has been delayed by a few weeks as the new greenhouse gas model awaits approval from the Treasury Department, USDA head Tom Vilsack said on March 1, according to Argus Media. The Biden administration was supposed to announce new guidance by March 1, with industry hopes pinned on a viable pathway for corn-based ethanol-to-SAF. Vilsack confirmed the model would be used to determine emissions for ethanol-to-SAF, according to Argus Media. The adjustment to the Department of Energy’s GREET model aims to ensure crediting for farming practices which reduce environmental impact like cover crops and no-till farming.
- EJAC Advises Delay to LCFS Scoping Vote. The CARB’s Environmental Justice Advisory Committee (EJAC) urged the Board to delay its LCFS vote until July 2024 as the current plan relies too heavily on biofuels and out-of-state biogas. Spot LCFS prices did largely stabilized in the wake of the EJAC meeting as the comments do not represent formal recommendations. Market participants are increasingly anticipating significant delays in the implementation of much-needed amendments to the LCFS which has proved bearish for prompt credit prices.
- Former CARB Chief Cheryl Laskowski Comments on Auto-Acceleration Mechanism. Cheryl Laskowski, former CARB Chief of Transportation Fuels, issued comments on the auto-acceleration mechanism (AAM) and RNG phaseouts contained in the states’ proposed scoping plan. Laskowski noted that the AAM would address oversupply of credits in the LCFS programs by triggering two checks. The AAM would be triggered if the credit to deficit ratio is greater than one, or if the total credit bank exceeds three quarters of annual deficit. The AAM can not be implemented before 2027, according to comments by Laskowski, and could not be triggered two years in a row. Laskowski commented on the state’s proposal to phase out crediting pathways for RNG for vehicle use by 2040 saying the language was not clear enough. Laskowski said the proposal could be interpreted to allow a project certified in December 2029 to earn avoided methane credits through 2060. The proposal is under a 45-day public comment period ending February 20.
- CARB Releases Proposed LCFS Amendments Ahead of March 21 Public Hearing. On December 19, California’s Air Resources Board (CARB) released a preliminary LCFS proposal laying out amendments which nearly mirrored those in the Standardized Regulatory Impact Assessment released in September. CARB proposed a 30% reduction in carbon intensity by 2030, including a 5% step-down in 2025. This marks a 50% increase in carbon targets over the original 20% reduction target for 2030. Reductions increase to 90% by 2045 compared to a 2010 baseline. The proposal contained an automatic acceleration mechanism (AAM) which would advance stringency for a given year when unused credits more than triple average deficit generation by advancing the carbon reduction target by two years. Amendments included eliminating the exemption for intrastate jet fuel beginning in 2028 and new tracking requirements for crop-based and forestry-based feedstocks to their point of origin. The regulator proposed phasing out biogas used in transportation fuel by 2041 and by 2045 for biomethane used to produce renewable hydrogen. CARB expects to kick off the required 45-day public comment period in January, with a public hearing set for March 21, 2024.
- Washington Aims for SAF Eligibility in Rulemaking Update. The Washington Department of Ecology will begin rulemaking early 2024 to advance SAF pathways for credit generation as early as December 31, 2023. Earlier this year, Washington legislators passed a law requiring the department to accept SAF applications by the end of 2023 and accepting biomethane as a feedstock for renewable diesel and SAF. The move builds on the state’s SAF credit eligible for SAF sold on flights departing the state. The $1/gallon base credit value can reach a maximum of $2/gallon based on each percentage point in carbon reduction under 50%. Next year’s round of rulemaking will seek to establish a third-party verification program, incentives to encourage SAF production, update book-and-claim accounting requirements for electricity and methane. Washington is not adjusting current annual targets, land-use change requirements and models that set fuel carbon intensity scores.
Market Update
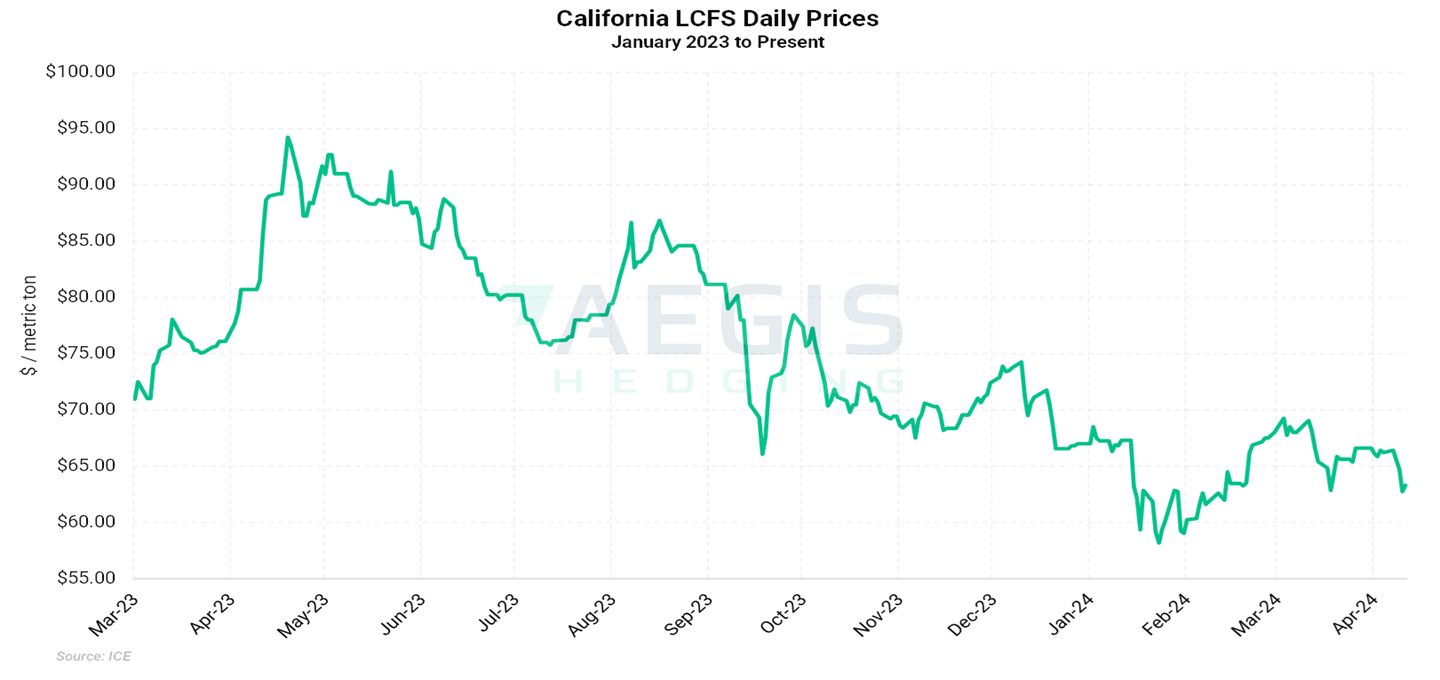
- CARB reported an average California LCFS transfer price of $66.00/t in March 2024, up $4/t, or 6.5% from February 2024. February’s transfer price of $62.00/t was the lowest since October 2015. March saw a transfer price range of $56/t to $88/t per credit with 221 entities only selling against 30 entities only buying. March ICE futures averaged $66.55/t over the course of the month of March.
- Just under 4MM t of credits moved across 243 transfers, up 21% from February’s 201 transfers. March transfers were down 3.5% on year-ago levels, though volumes increased 48% over the same period. Total 2023 transfers came in at just under 40.2MM t of credits, up 31% from 2022 totals.
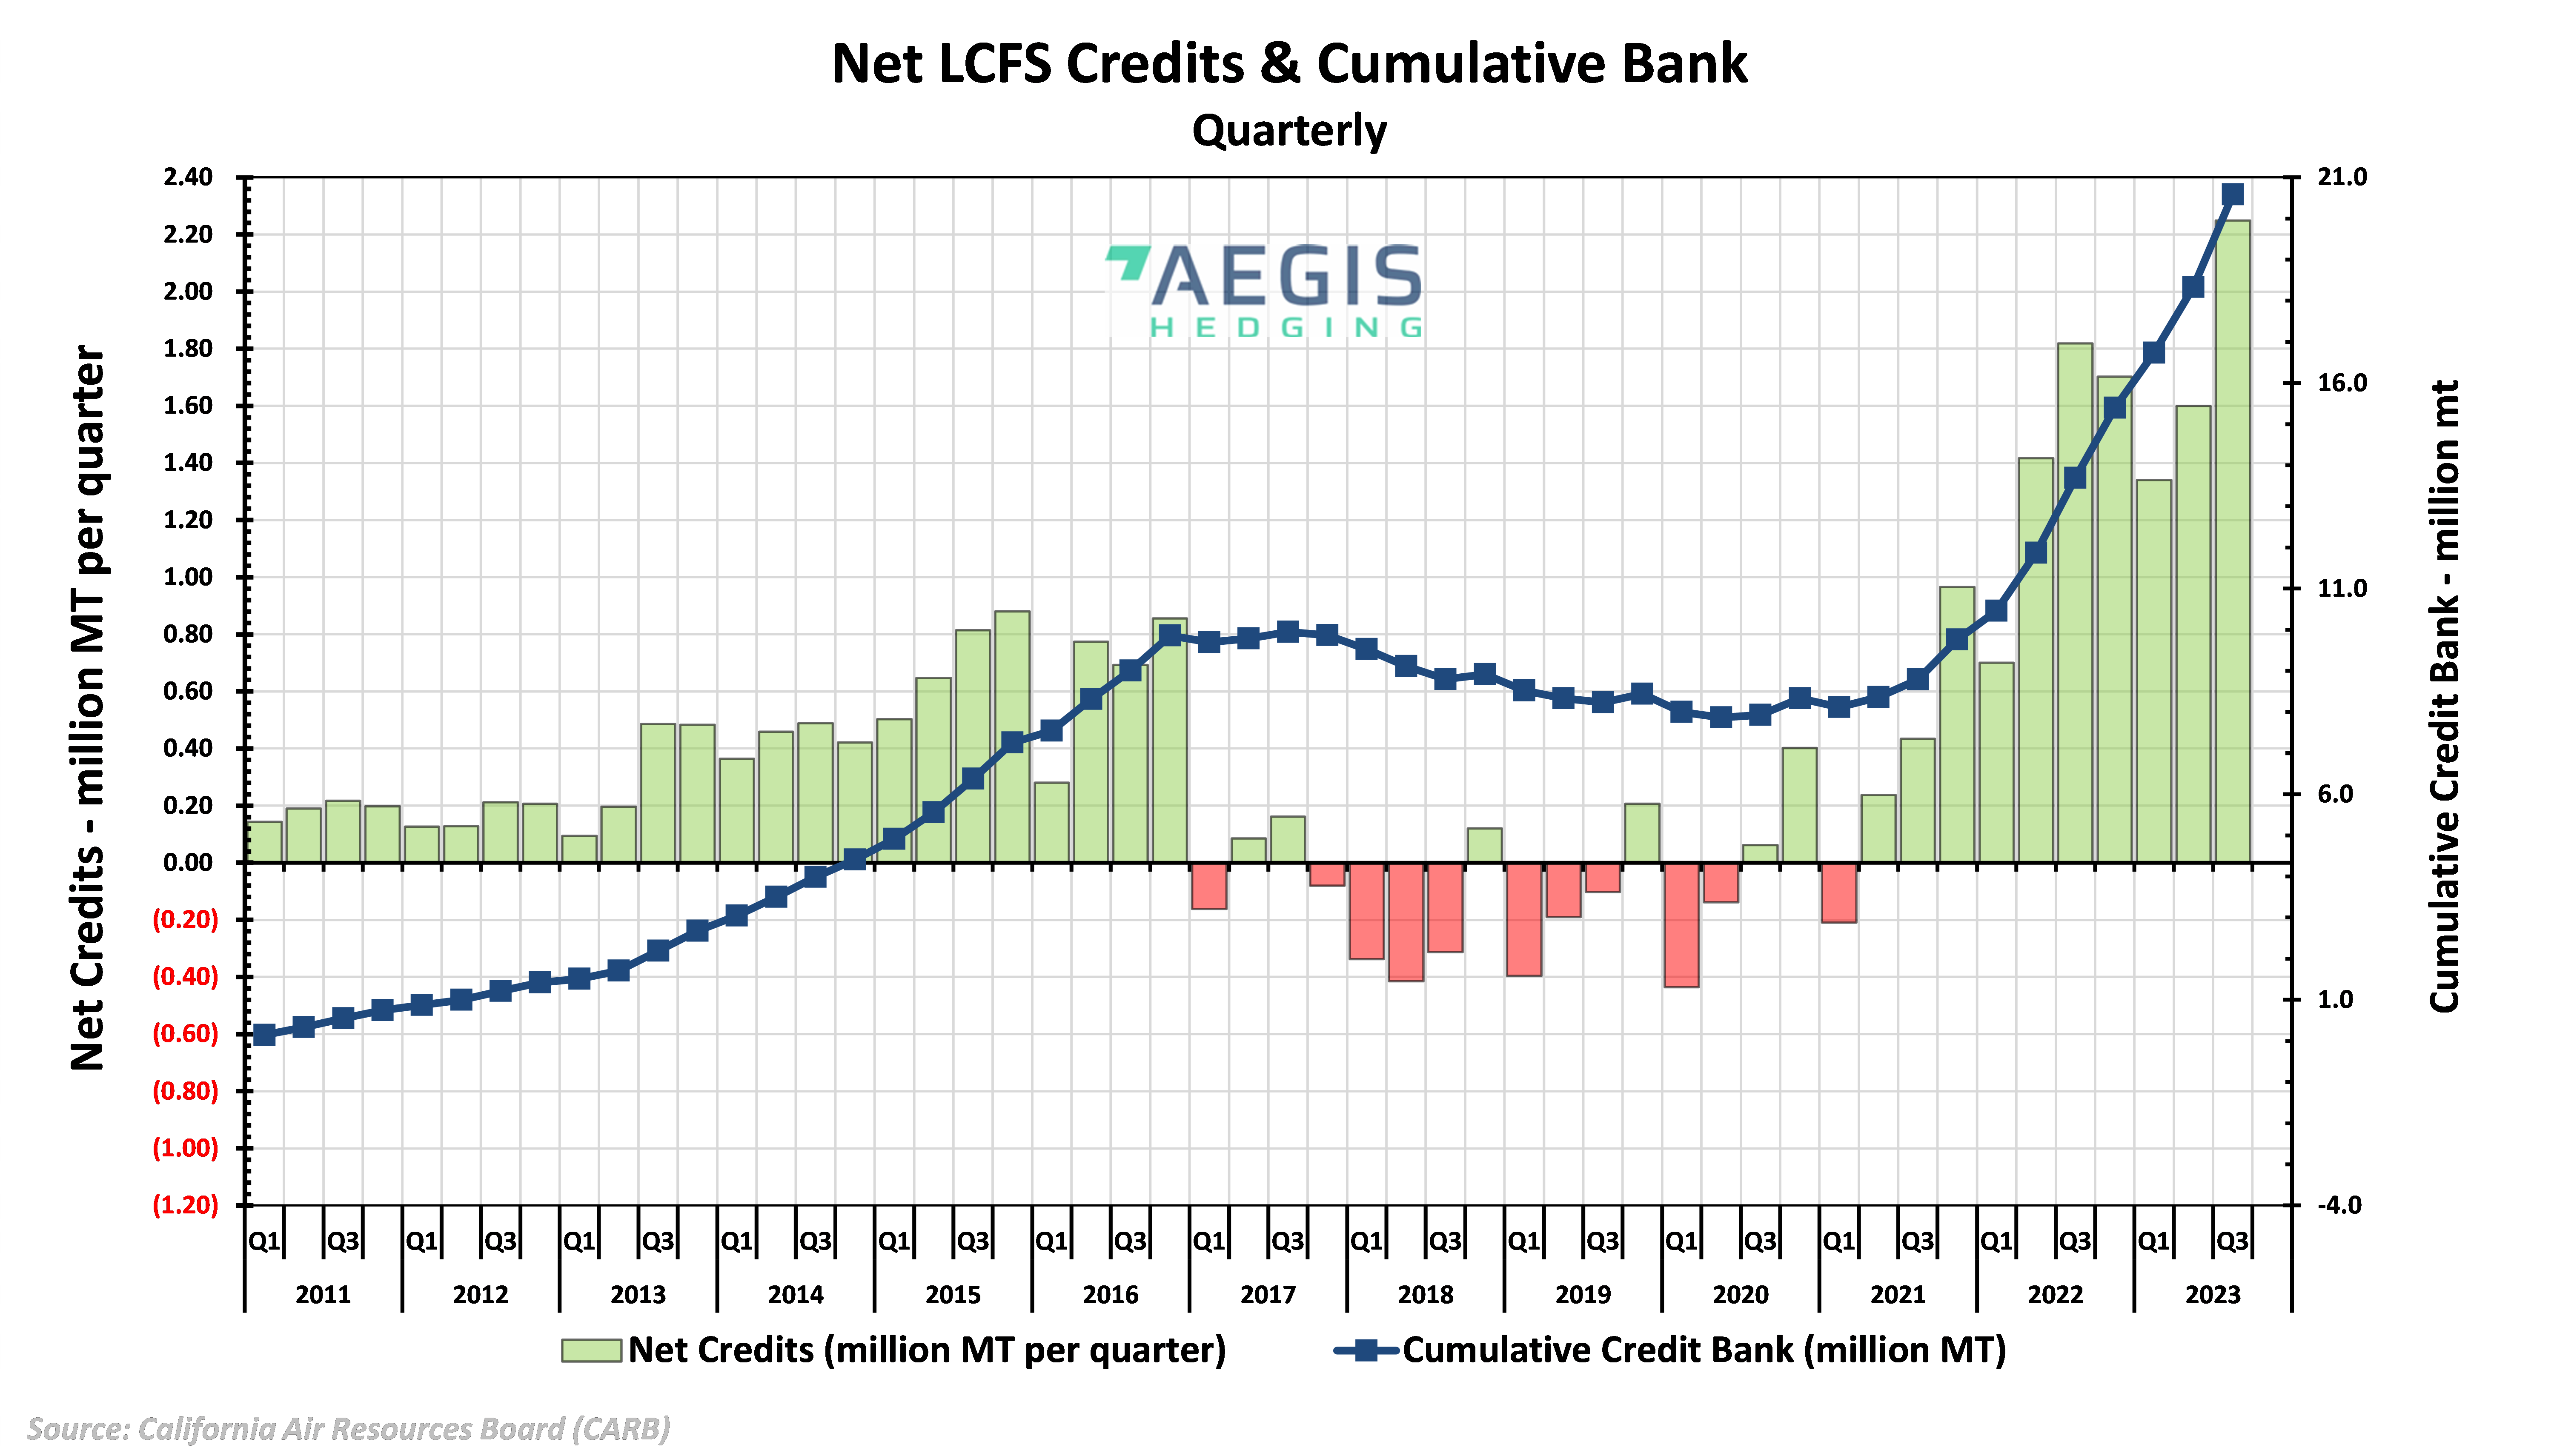
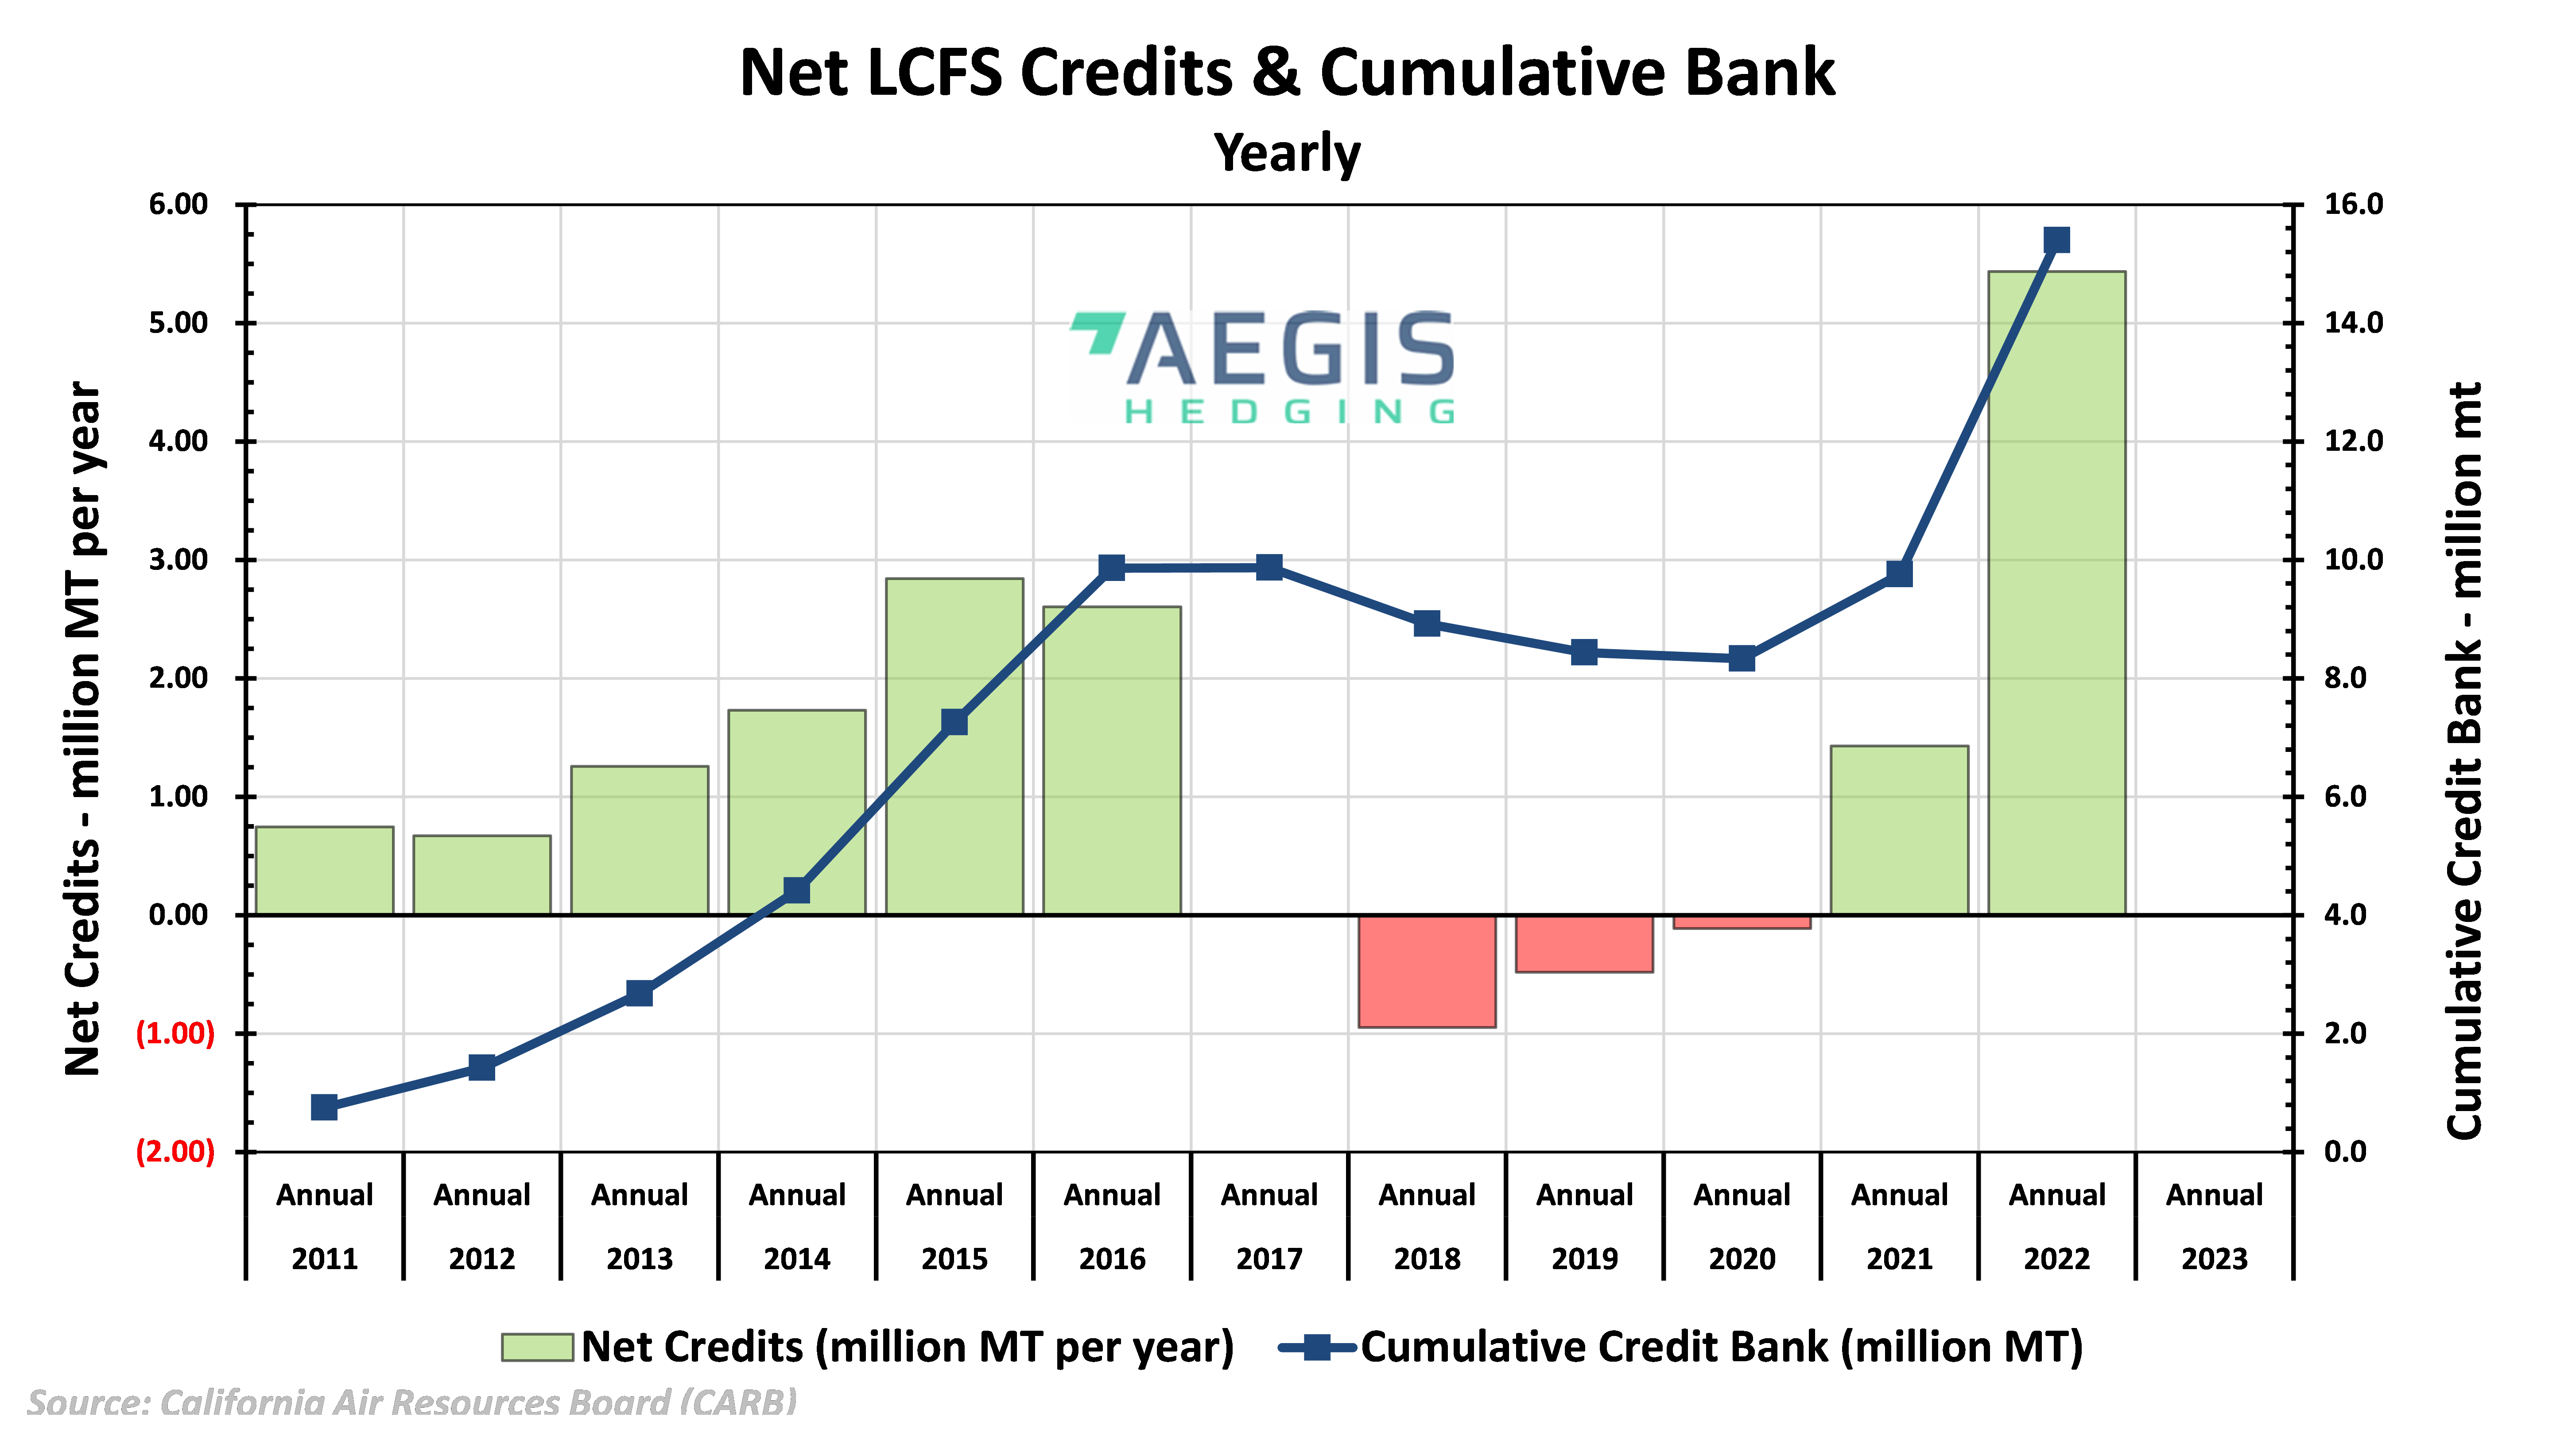
- California LCFS credits traded down to $62.75/t as traders reacted bearishly to a public workshop held by CARB on April 10 which was short on details and differed little from the original December 2023 proposal. The March market reached as high as $66.81/t ahead of the workshop, before materials released on April 9 showed CARB would not be considering a 35% step down for 2030. Q3 data showed a fresh record surplus of 20.6MM t of unused credits, with the bank growing by 2.2MM t, or 12%, from the previous quarter. The cumulative credit bank has grown by 6.9MM t, or 50%, over the course of the last four quarters.
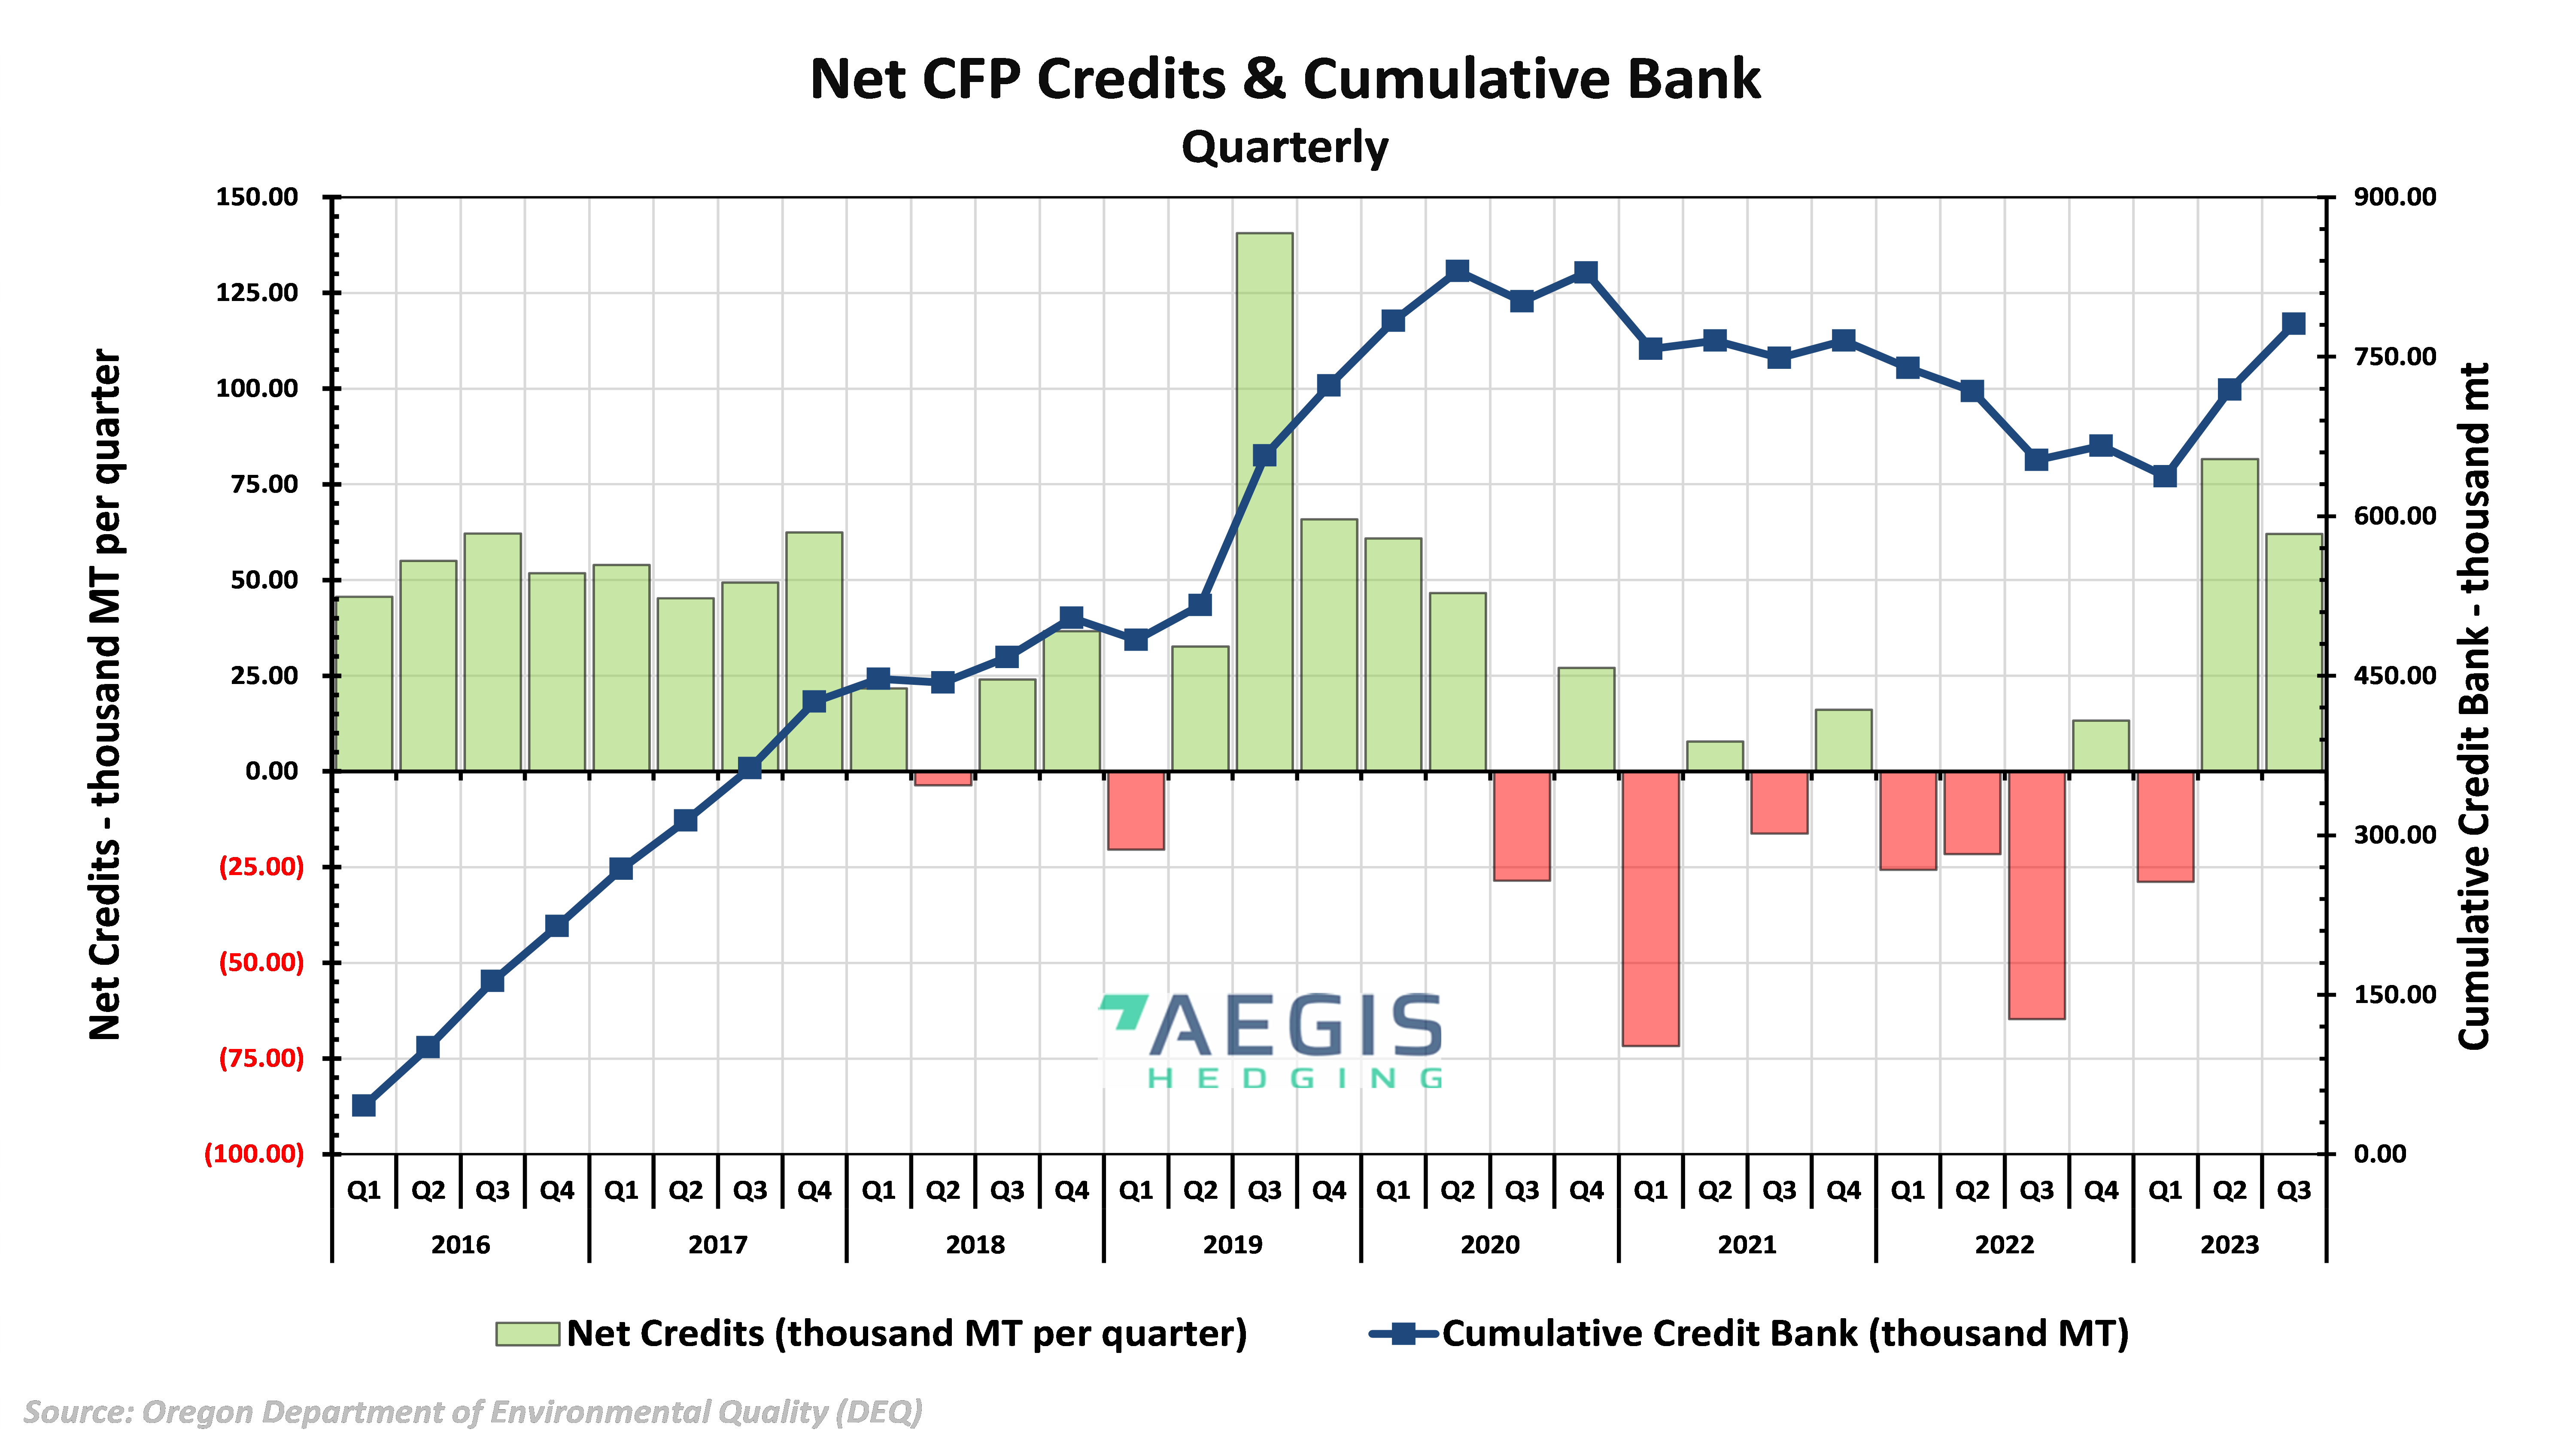
- Oregon DEQ reported 239,223 metric tons across 33 transfers in March 2024. Transfers rose by 8, or 32%, while month-over-month volumes increased by 1,306 credits, or less than one percent. March saw an average transfer price of $97.88/credit, down 26% from February’s price of $132.03/credit. Oregon DEQ quarterly data showed 321,791 credits generated from renewable diesel during Q3, up 33% from the previous quarter and accounting for 47% of all credits generated. Biodiesel generated 128,222 credits, up 21% from the previous quarter and accounting for 19% of all credits generated.
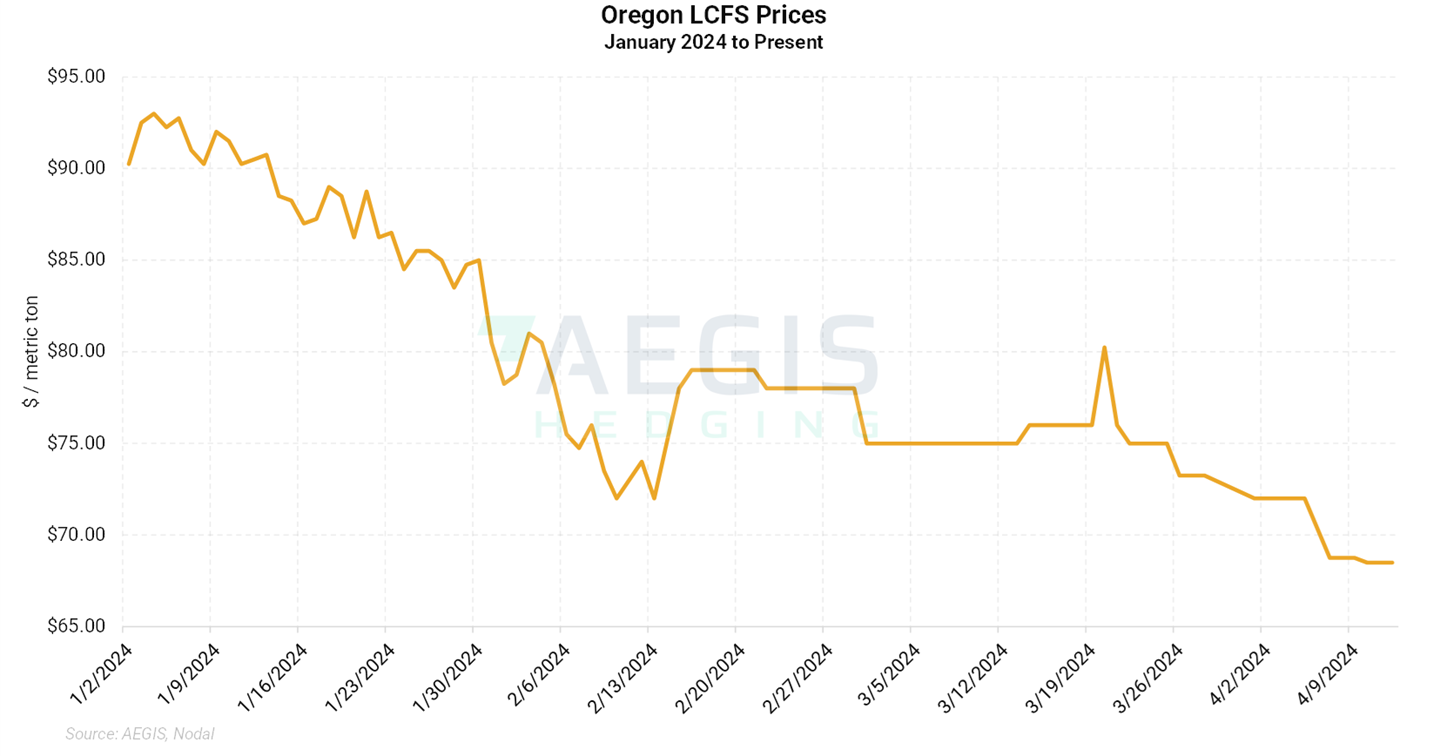
- Oregon LCFS credit prices spent the bulk of March around the $75.00/t mark, after closing the month of February at $78.00/t. The market started April at $72.00/t, before slipping to $68.50/t by midmonth, down 24% since the start of the year. The state’s spot credit price narrowed to a premium of $5.2/t to California LCFS credits and $30/t to concurrent Washington CFS credits.
- The California LCFS market remains acutely oversupplied with the bank of available credits setting a fresh record high for the third quarter of 2023 and credits outpacing deficits by an increasing gap since July 2020. The outlook for CARB to adopt more stringent CI targets alongside possible limitations to certain fuels and pathways should limit material losses in the near term. The market could find medium-to-long-term support should CARB pursue appropriately stringent targets for early 2025 implementation.
LCFS & CFP Schedule
| California LCFS Q4 2023 Reporting Deadline |
April 21st, 2024 |
|
|
|
|
|
|
|
| Start of 30-day Public Comment Period |
April 10th, 2024 |
|
|
|
|
|
|
|
| CARB Regulatory Proposal & Updated Modeling |
Late Spring 2024 |
|
|
|
|
|
|
|
|
|
|
|
|
LCFS Credit & Futures Pricing
| Credit Prices as of April 12th, 2024: |
California Futures Prices as of April 12th, 2024: |
- California - Futures: $ 63.30
|
|
- Oregon - Futures: $ 68.50
|
|
- Washington - Futures: $ 38.50
|
|
LCFS Cost for Gasoline and Diesel
|
California, as of April 12th, 2024:
|
Oregon, as of April 12th, 2024:
|
- CARBOB (No Cl ethanol) - Vintage 2024: 9.40 cents per gallon
|
- E10 gasoline - Vintage 2024: 6.37 cents per gallon
|
- CARB ULSD - Vintage 2024: 10.69 cents per gallon
|
- B5 diesel – Vintage 2024: 7.25 cents per gallon
|
Monthly Credit Transfer Activity for California
|
Time
|
Transfers
|
Total Volume
|
Avg $/credit
|
|
24-Mar
|
243
|
3,999,000
|
$66
|
|
24-Feb
|
201
|
1,911,000
|
$62
|
|
24-Jan
|
526
|
6,196,000
|
$69
|
|
23-Dec
|
422
|
6,161,000
|
$73
|
|
23-Nov
|
203
|
2,672,000
|
$70
|
|
23-Oct
|
451
|
4,661,000
|
$76
|
|
23-Sep
|
233
|
1,033,000
|
$73
|
|
23-Aug
|
168
|
2,044,000
|
$77
|
|
23-Jul
|
417
|
4,347,000
|
$75
|
| 23-Jun |
222 |
2,470,000 |
$79 |
| 23-May |
158 |
1,684,000 |
$81 |
| 23-Apr |
547 |
5,596,000 |
$74 |
|
23-Mar
|
252
|
2,702,000
|
$73
|
|
CY 2023
|
3,704
|
40,186,000
|
$75
|
|
CY 2022
|
3,137
|
30,641,000
|
$125
|
|
CY 2021
|
2,664
|
25,279,000
|
$187
|
|
CY 2020
|
2,461
|
21,728,000
|
$199
|
|
CY 2019
|
1,656
|
14,146,000
|
$192
|
|
CY 2018
|
1725
|
13,334,000
|
$160
|
|
CY 2017
|
1226
|
8,875,000
|
$89
|
|
CY 2016
|
929
|
5,343,000
|
$101
|
|
CY 2015
|
578
|
2,852,000
|
$62
|
|
CY 2014
|
304
|
1,667,000
|
$31
|
|
CY 2013
|
202
|
887,000
|
$55
|
Source: https://ww2.arb.ca.gov/resources/documents/monthly-lcfs-credit-transfer-activity-reports
Monthly Credit Transfer Activity for Oregon
|
Time
|
Transfers
|
Total Volume
|
Avg $/credit
|
| 24-Mar |
33 |
239,223 |
$97.88 |
| 24-Feb |
25 |
237,917 |
$132.03 |
| 24-Jan |
40 |
175,832 |
$118.99 |
| 23-Dec |
45 |
353,436 |
$137.96 |
| 23-Nov |
35 |
164,936 |
$129.97 |
| 23-Oct |
34 |
188,537 |
$143.93 |
| 23- Sep |
23 |
102,570 |
$141.94 |
| 23- Aug |
29 |
188,709 |
$137.33 |
| 23- Jul |
32 |
166,522 |
$137.93 |
| 23-Jun |
28 |
123,401 |
$130.21 |
| 23-May |
30 |
121,556 |
$131.04 |
|
23-Apr
|
69
|
322,461
|
$121.73
|
|
23-Mar
|
50
|
345,944
|
$118.85
|
|
CY 2023
|
442
|
2,421,140
|
$129.76
|
|
CY 2022
|
319
|
1,607,127
|
$119.01
|
|
CY 2021
|
245
|
1,035,306
|
$125.30
|
|
CY 2020
|
151
|
806,028
|
$128.08
|
Source: https://www.oregon.gov/deq/ghgp/cfp/Pages/Monthly-Data.aspx
Monthly Credit Transfer Activity for Washington
|
Time
|
Transfers
|
Total Volume
|
Avg $/credit
|
| 24-Mar |
8 |
76,029 |
$55.53 |
| 24-Feb |
16 |
62,672 |
$89.89 |
| 24-Jan |
12 |
80,921 |
$79.85 |
| 23-Dec |
8 |
58,288 |
$74.06 |
| 23-Nov |
- |
- |
- |
| 23-Oct |
10 |
49,930 |
$98.12 |
| 23- Sep |
20 |
51,322 |
$96.26 |
| 23- Aug |
4 |
27,055 |
$106.66 |
| 23-Jul |
0 |
0 |
- |
|
CY 2023
|
42
|
186,595
|
$91.23
|
|
CY 2022
|
-
|
-
|
-
|
|
CY 2021
|
-
|
-
|
-
|
Source: https://ecology.wa.gov/air-climate/reducing-greenhouse-gas-emissions/clean-fuel-standard/data-reports
Figure 1. California LCFS Prompt USD/mt January 2023 - Present
|
|
|
|
|
2023 Average Daily Price: $ 75.79
|
2024 Average Daily Price: $ 64.76
|
|
2023 Highest Daily Price: $ 87.00
|
2024 Highest Daily Price: $ 68.95
|
|
(May 9th, 2023)
|
(March 4th, 2024)
|
|
|
Figure 2. Oregon LCFS Prompt USD/mt January 2024 - Present
|
|
|
2024 Average Daily Price: $79.65
|
|
2024 Highest Daily Price: $93.00
|
|
(January 4th, 2024)
|
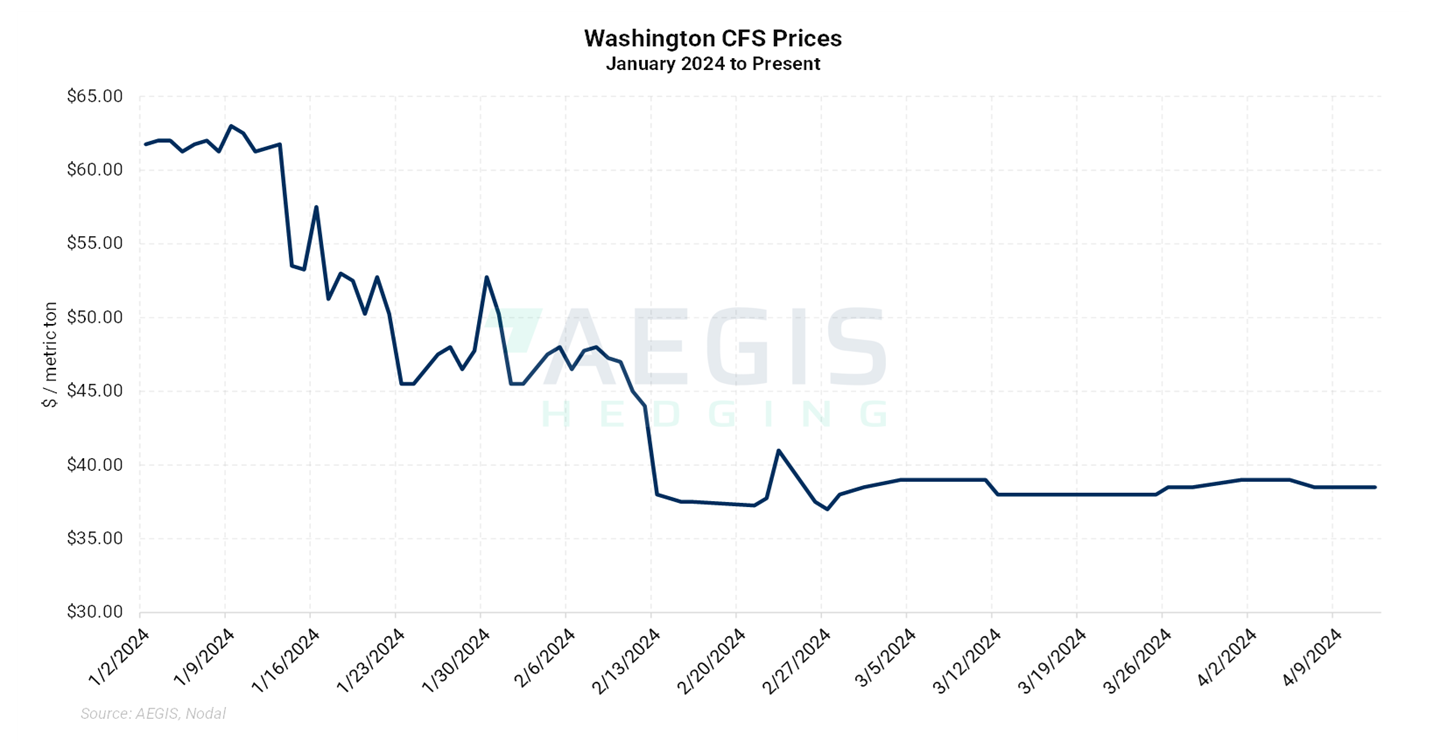
Figure 3. Washington CFS Prompt USD/mt January 2024 - Present
|
|
|
2024 Average Daily Price: $45.43
|
|
2024 Highest Daily Price: $63.00
|
|
(January 9th, 2024)
|
Figure 4. California LCFS Net Credits & Cumulative Bank Volume - Quarterly
Figure 5. California LCFS Net Credits & Cumulative Bank Volume - Yearly
Figure 6. Oregon CFP Net Credits and Cumulative Bank Volume - Quarterly
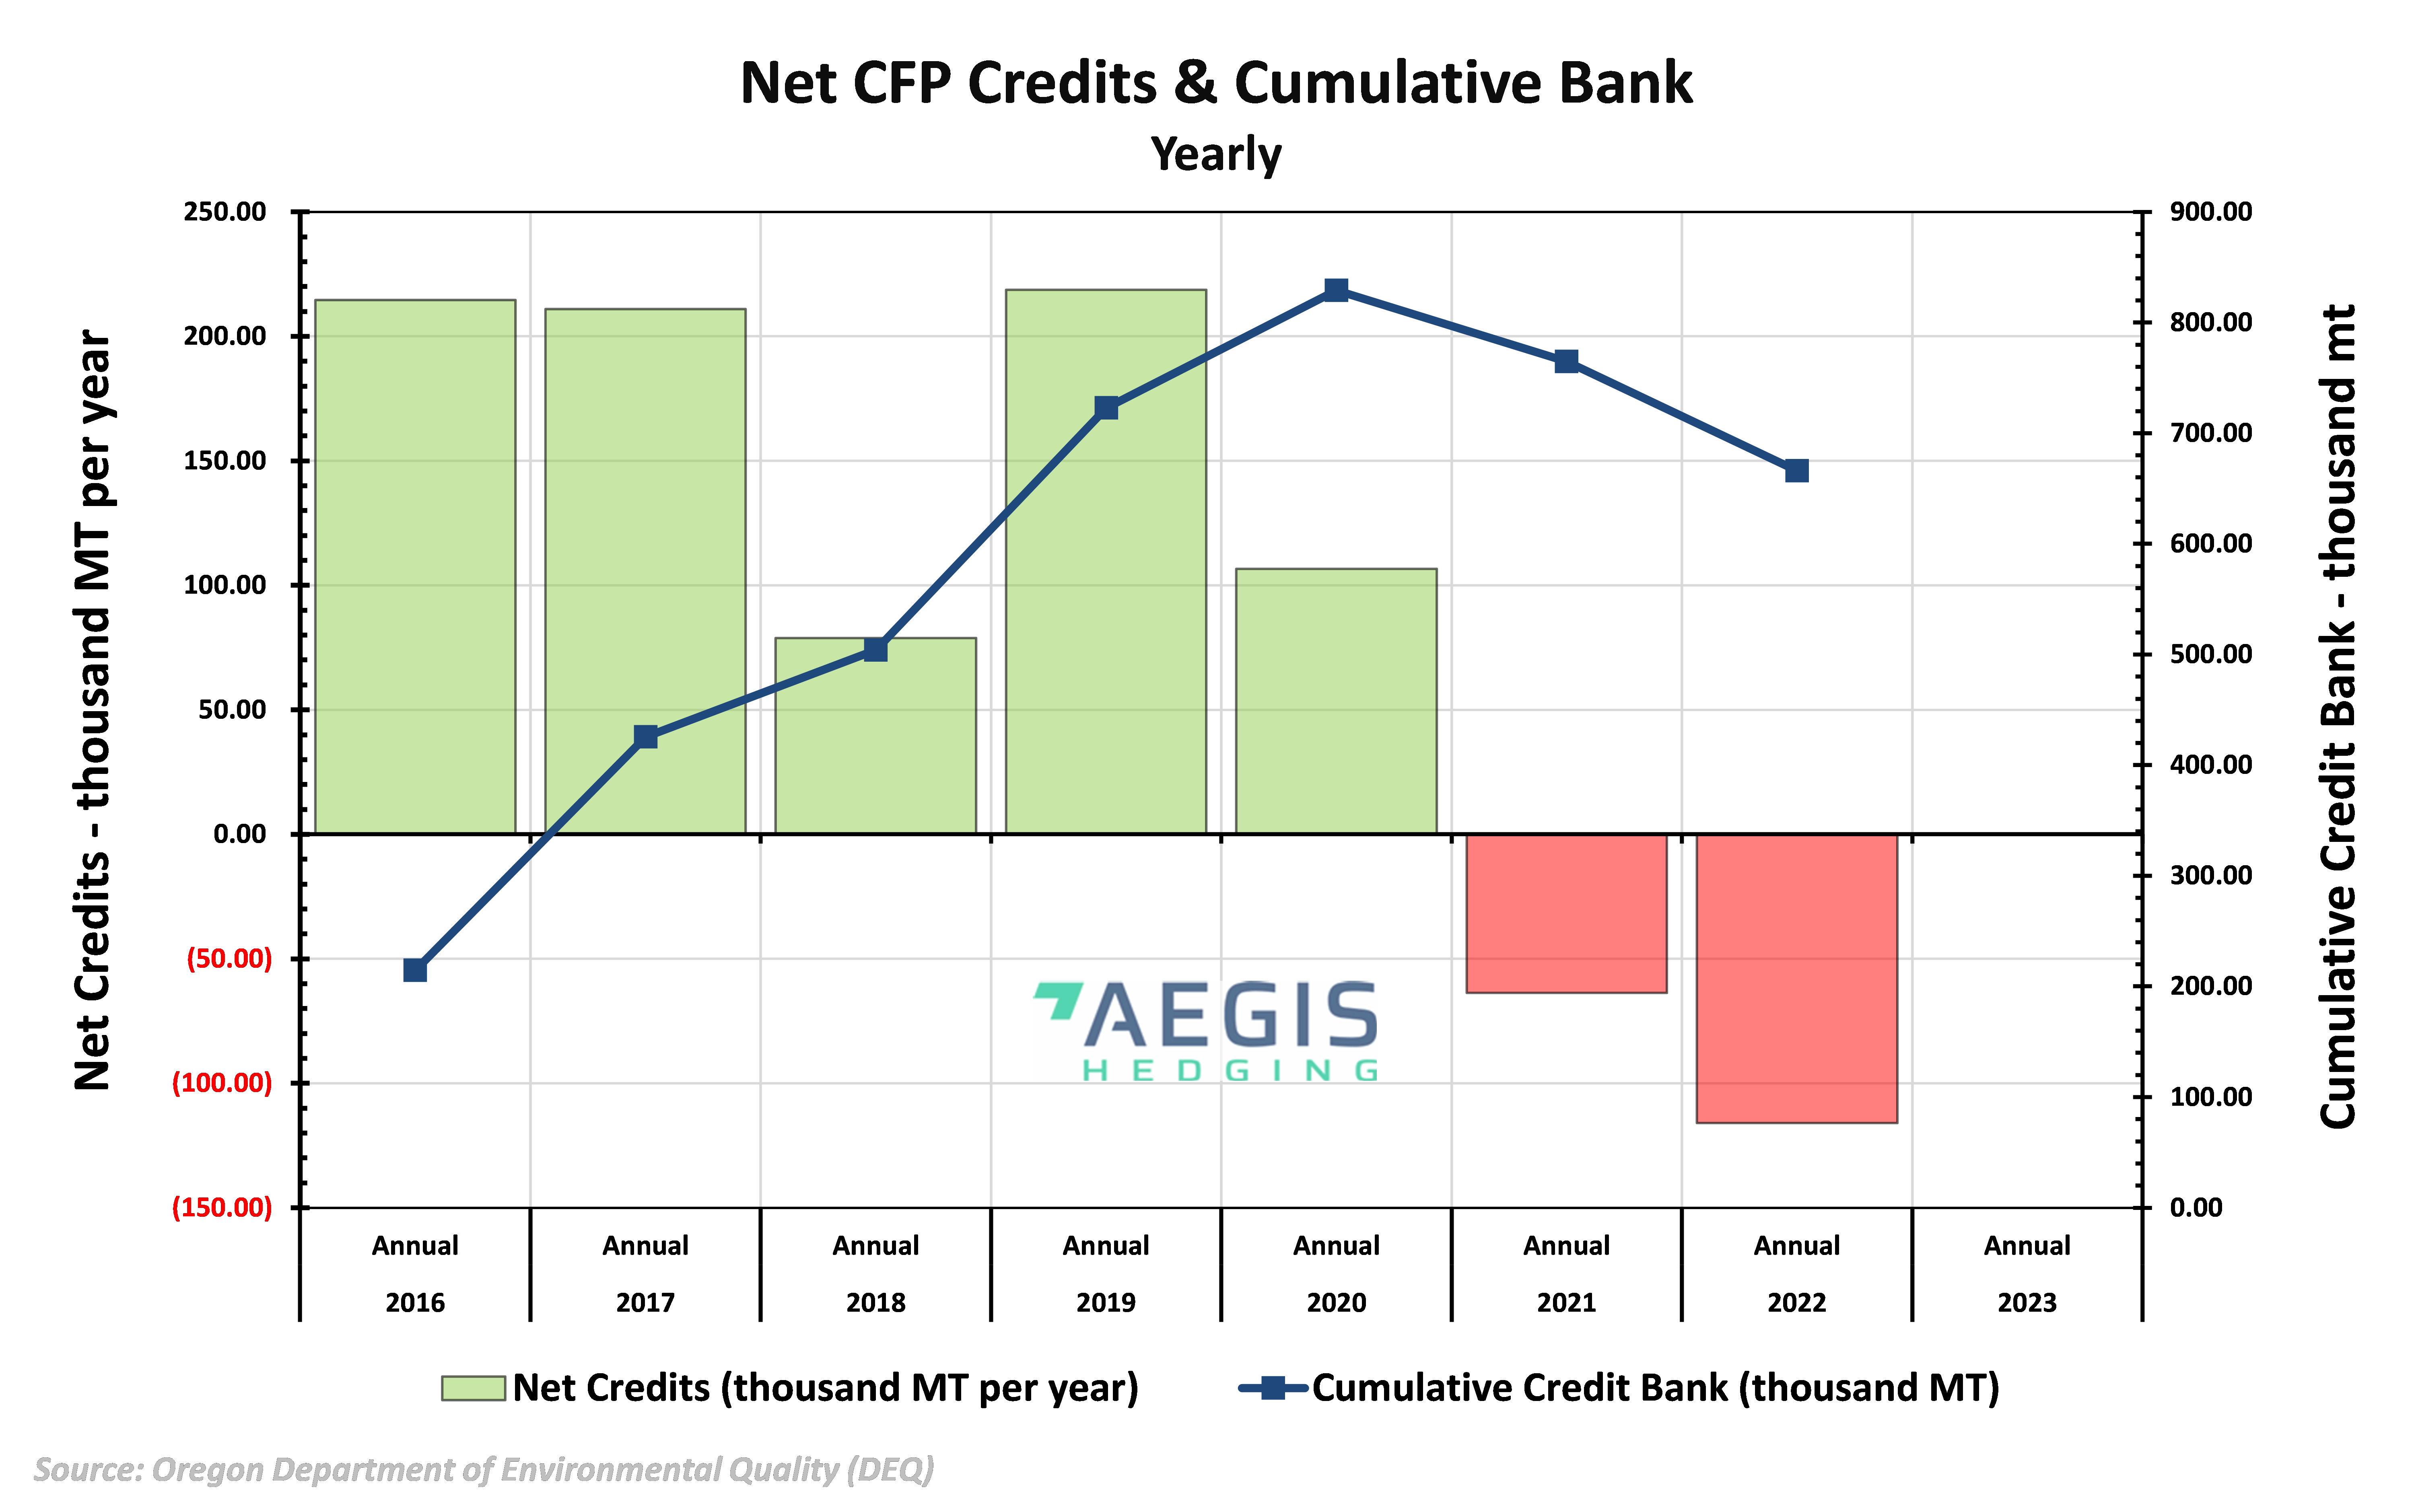
Figure 7. Oregon CFP Net Credits and Cumulative Bank Volume - Yearly
Figure 8. Washington CFS Net Credits and Cumulative Bank Volume - Quarterly
Questions? Contact our team for more information: environmental@aegis-hedging.com
CONFIDENTIAL – UNAUTHORIZED THIRD-PARTY DISTRIBUTION PROHIBITED