To quickly access the page content, please click on the links below:
News Update
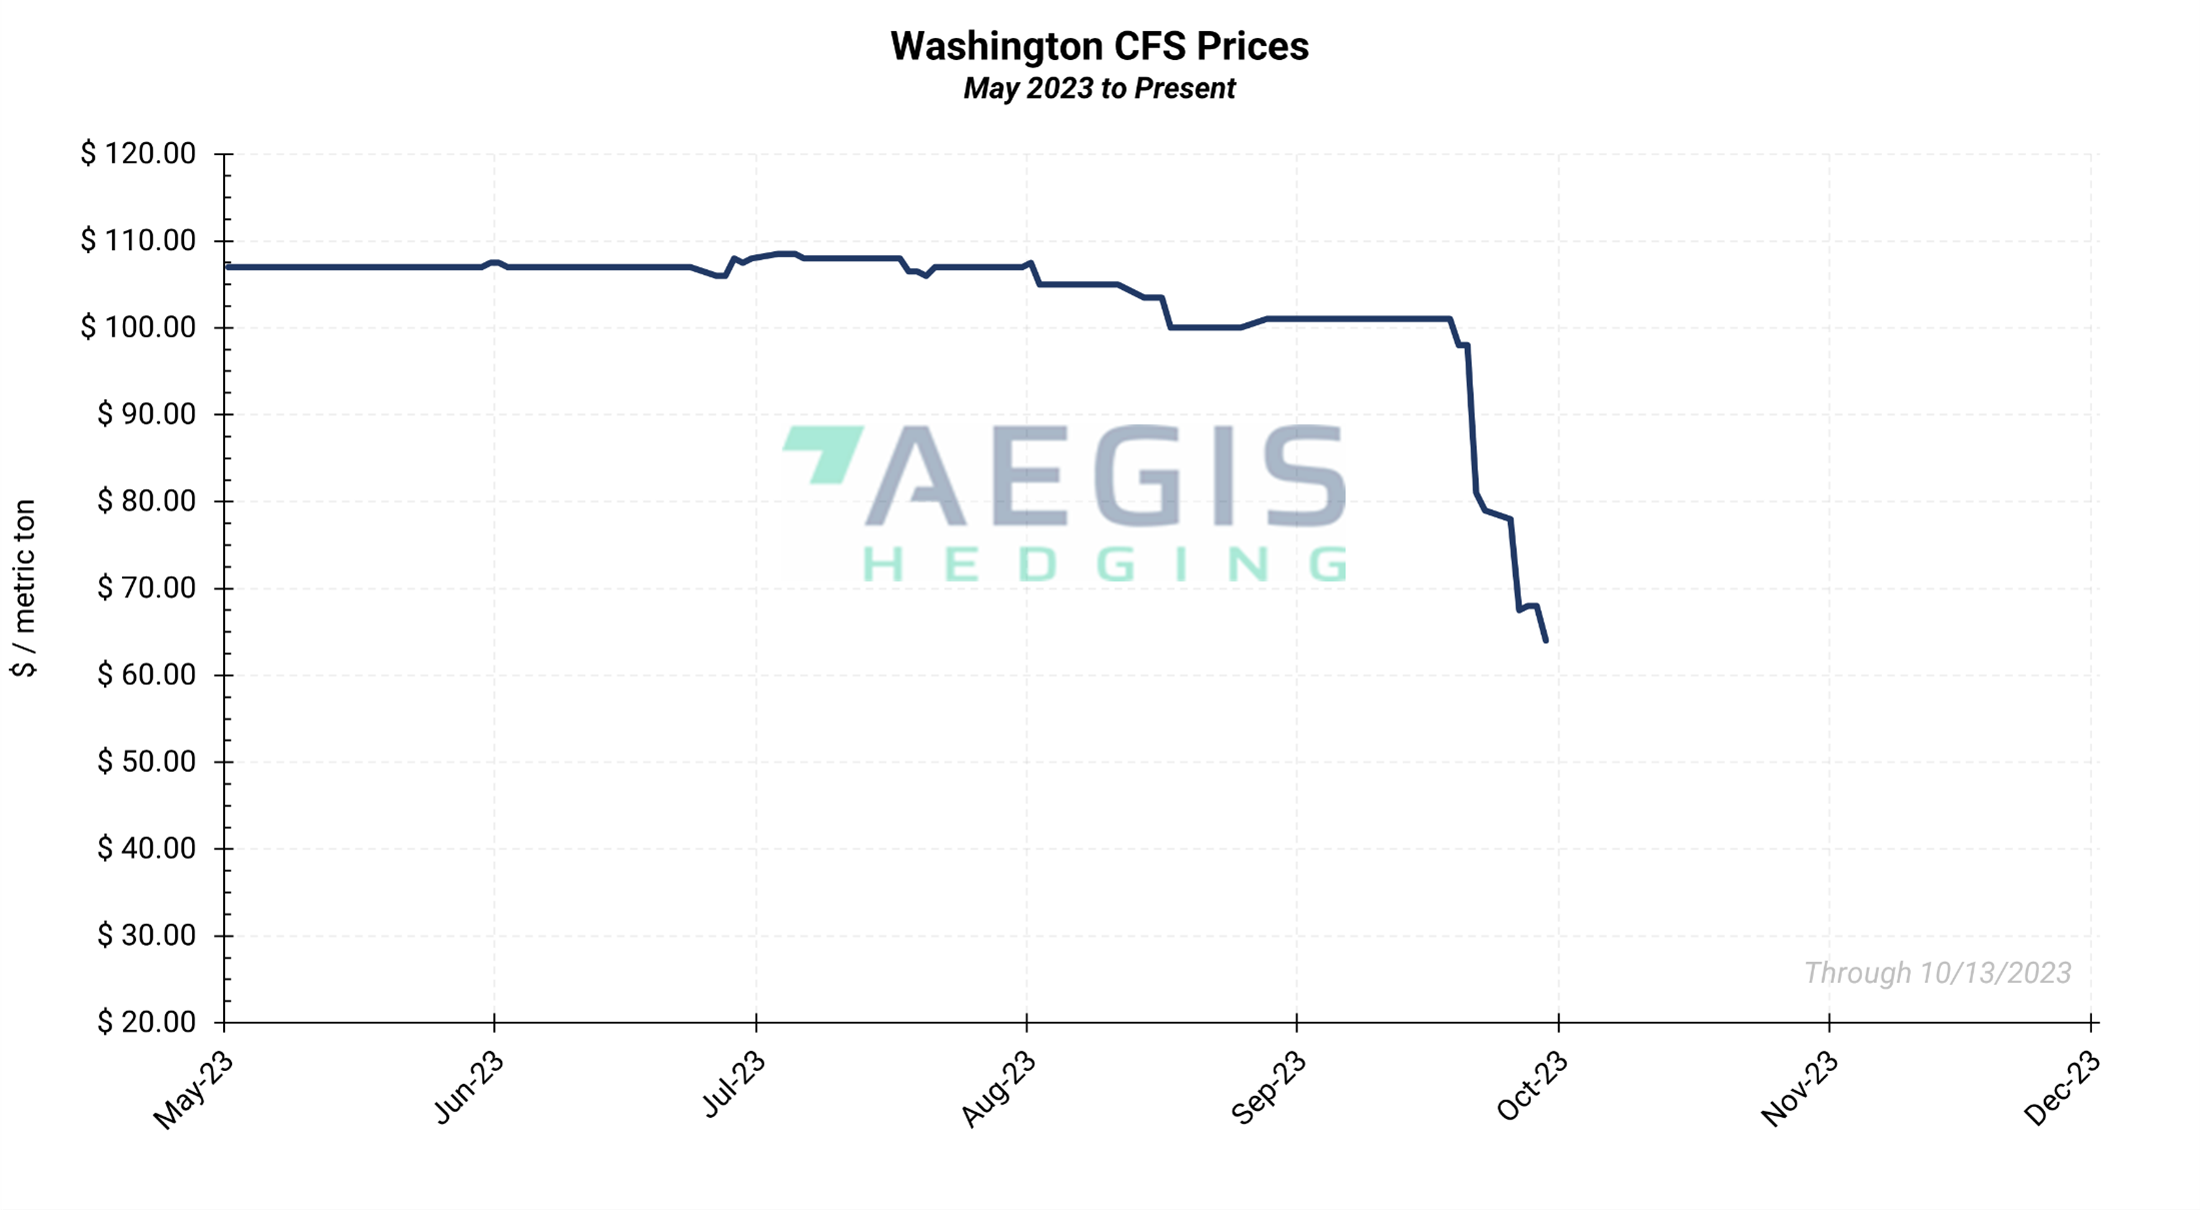
- The Washington Clean Fuel Standard Posts Net Credit Surplus for the First Quarter. A total of 275,442 credits were generated, with ethanol accounting for 64% of the total and renewable diesel making up 12%, according to the state’s inaugural quarterly report. Deficits came in at 227,768, for a quarterly surplus of 47,674 credits. The market reacted bearishly with prompt credits tumbling to $79/t from $101/t, or 22%, over the span of just a week.
- California Judge Blocks P66 Rodeo Production Until Permitting Resolution. A California judge ruled that P66’s 67,000 Bbl/d Rodeo facility may not operate until permitting issues are resolved. The largest renewable diesel refinery conversion in the country is allowed to continue construction. The original permitting work for the plant took nearly a year to complete in May 2022. P66 aims to begin renewable diesel production at Rodeo by Q1 2024.
- CARB Releases Proposed 2023 Amendments in SRIA. On September 8, California’s Air Resources Board (CARB) released the Standardized Regulatory Impact Assessment (SRIA) containing ten proposed amendments for 2023. The SRIA proposed a 30% reduction in carbon intensity by 2030, including a 5% step-down in 2025. The SRIA contained an automatic acceleration mechanism (AAM) which would advance stringency for a given year when specific regulatory conditions are satisfied by advancing the carbon reduction target by two years. CARB proposed to eliminate the exemption for intrastate fossil jet fuel and phase out avoided methane crediting for dairy and swine manure pathways and for landfill-diversion pathways by 2040. CARB aims to limit RNG book-and-claim accounting, requiring fuels to be consumed in California. CARB proposed to expand ZEV infrastructure crediting to the medium- and heavy-duty sector. The proposal would allow for book-and-claim for low carbon intensity hydrogen. Project-based crediting for petroleum projects would be phased out by 2040. CARB proposed to decrease credits generated by forklifts less than 12,000-pound lift capacity. According to CARB models, a 5% step down (18.75% by 2025 mandate) would generate nearly 12 million deficits.
- CARB May Seek Carbon Intensity Reductions Beyond 30%. CARB executive officer Steven Cliff indicated a 30% reduction in carbon intensity by 2030 may represent a floor for the agency’s final proposal, speaking at an Argus conference in Monterey, California. Cliff declined to comment on specific levels, “but noted that Oregon last year updated its LCFS program with a target of 37% by 2035,” according to Argus. CARB officials said the proposed targets in SRIA were not final and that more stringent targets could take effect by mid-2024. Cliff said CARB is aiming to have a proposal ready by November, which would be sent to the board in the spring.
- CARB Delays LCFS Ruling Till 2024. California’s Air Resources Board (CARB) provided updated guidance on the timeline for its rulemaking process to usher in more stringent carbon intensity targets. The regulator aims to release a proposal after a late-September board meeting during which a non-voting LCFS item will be outlined. The proposal will face a 45-day public comment period allowing the item to be voted on at a board meeting in early 2024. The new targets could come into effect by mid-to-late 2024, or CARB could wait till January 1, 2025. CARB clarified that it would not retroactively apply the ruling to any part of the 2024 compliance year. The August 16 public workshop covered extensive modeling updates to its California Transportation Supply Model (CATS). The updated scenarios included material upward revisions in electrification of HDVs and MDVs, added in total out-of-state biomethane supply and built in a credit bank drawdown pathway. CARB did not factor alcohol-to-jet into the model as sufficient data was not available. Stakeholders raised concerns that the electricity CI used in the model was too high and took issue with using total out-of-state biomethane in the model while not adjusting for out of state competition and restrictions.
- EIA Boosts its 2023/2024 Renewable Diesel Production Forecast. The US Energy Information Administration (EIA) raised its 2023 RD production forecast by 0.6% to 170,000 Bbl/d in its October Short-Term Energy Outlook. RD production for 2024 was forecast at 228,000 Bbl/d, up by 5.6% from the previous month’s estimate.
- EVs Made up 24% of New California Car Sales. Electric Vehicles made up 24% of new car sales in California during the second quarter of 2023, according to data from the California Energy Commission. Second quarter car sales came in at 496,000 vehicles. The state aims for zero-emission vehicles to account for all new car sales by 2035.
- PG&E Lowers Auction Volume for First Time Since 2020. Pacific Gas & Electric (PG&E) offered 265,000 LCFS credits in their most recent late-August auction, marking the first reduction in auction volume since 2020. The utility offered a record volume of 289,000 LCFS credits at the end of May, ~20% more than the previous auction in March. PG&E generates credits by supplying low-carbon electricity for vehicle charging, and its quarterly offerings have climbed steadily from 72,000 credits in December 2020.
- CARB Breaks Down LCFS Auto-acceleration Design concepts. On May 23rd, 2023, California Air Resources Board (CARB) released two considerations for the auto-acceleration mechanism designed to increase stringency in the LCFS program. The first design would be triggered by a “credit to price bank (CPB)” ratio dropping below a threshold calculated by dividing the average credit price by the total number of banked credits. The second design would be triggered by a “credit to deficit (CtD)” ratio calculated by dividing the total number of credits generated by the total number of deficits generated. Both designs, if triggered, would advance the CI reduction schedule by one year, starting the following year after the trigger ratio is met. CARB also noted that if an auto-acceleration trigger occurred in the immediate prior year, then the current year cannot also activate the mechanism as the annual data used to determine the impacts of the newly ratcheted standard would not be ready for analysis. For example, if data for 2024 were to meet trigger criteria, the targets would be advanced starting in 2026, with triggers “locked” until 2028.
- Nodal Launches Washington WCA & CFP Futures Contracts. Nodal Exchange and IncubEx launched Washington Carbon Allowance (WCA) and Washington Clean Fuels Program (CFP) futures contracts in mid-August. The Washington CFP futures contract physically delivers credits issued by the Washington Department of Ecology via the Washington Fuel Reporting System Credit Bank and Transfer System (WFRS-CBTS).
Market Update
- CARB reported an average California LCFS transfer price of $73.00/t in September 2023, down $4/t, or 5.2%, from August 2023. This marked the highest lowest transfer price since March 2023.
- CARB reported 233 transfers in September 2023, a 39% increase from the 168 transfers reported in August as activity picked up following a traditionally inactive month for the program. The total credit transfer volume was 1,993,000 t compared to 2,044,000 t in August.
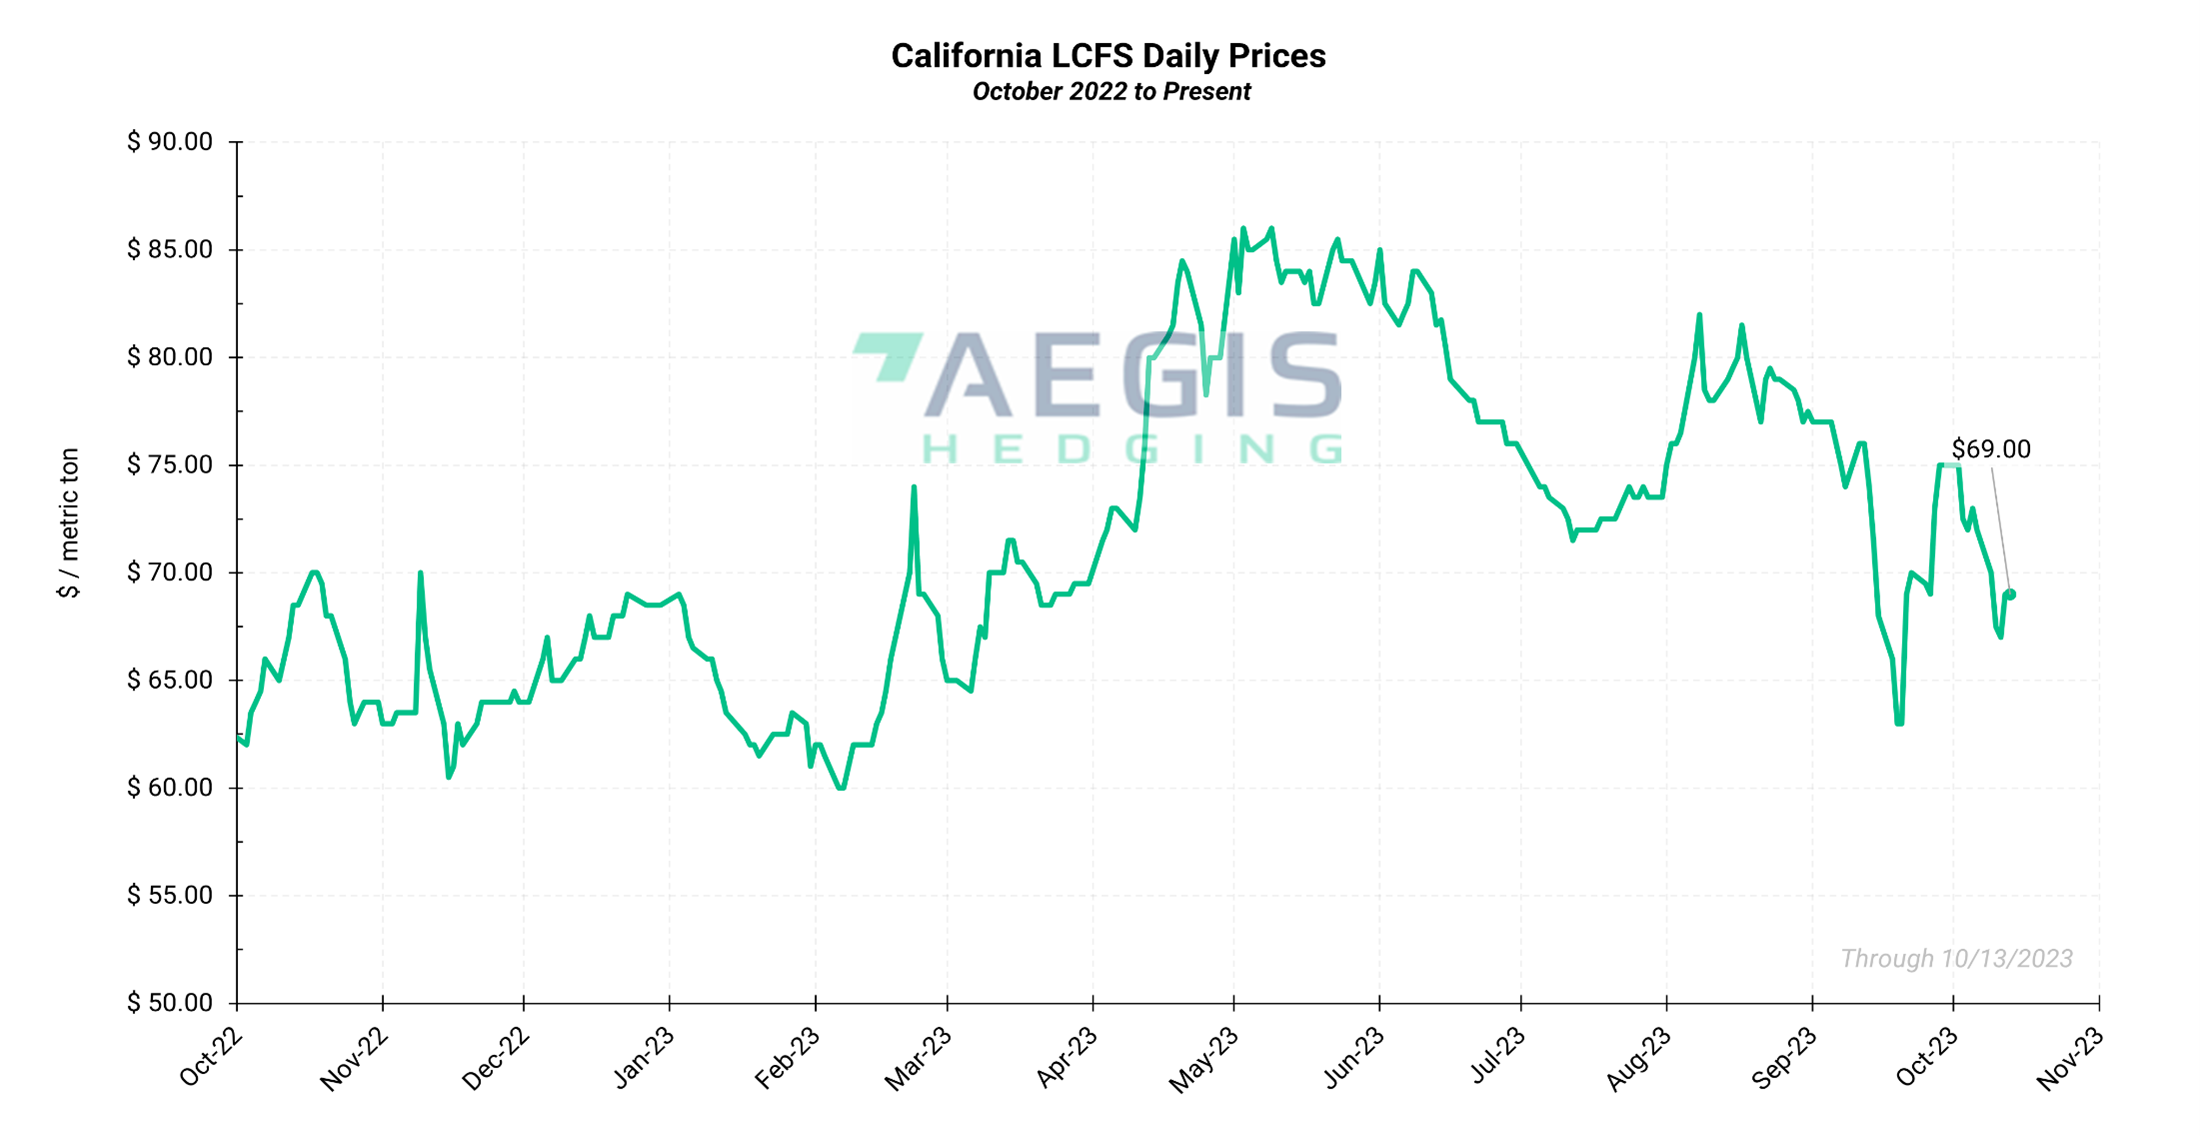
- California LCFS credits reached as low as $63.00/t by mid-September, marking the lowest level in more than half a year as the slow pace of regulatory reform sapped buying interest. The market recovered to $75.00/t by the close of the month as a board meeting on September 28 addressing the implementation of the state’s required scoping plan spurred renewed buying. Prompt credits fell $8/t, or 10.7%, to $67.00/t in the first half of October.
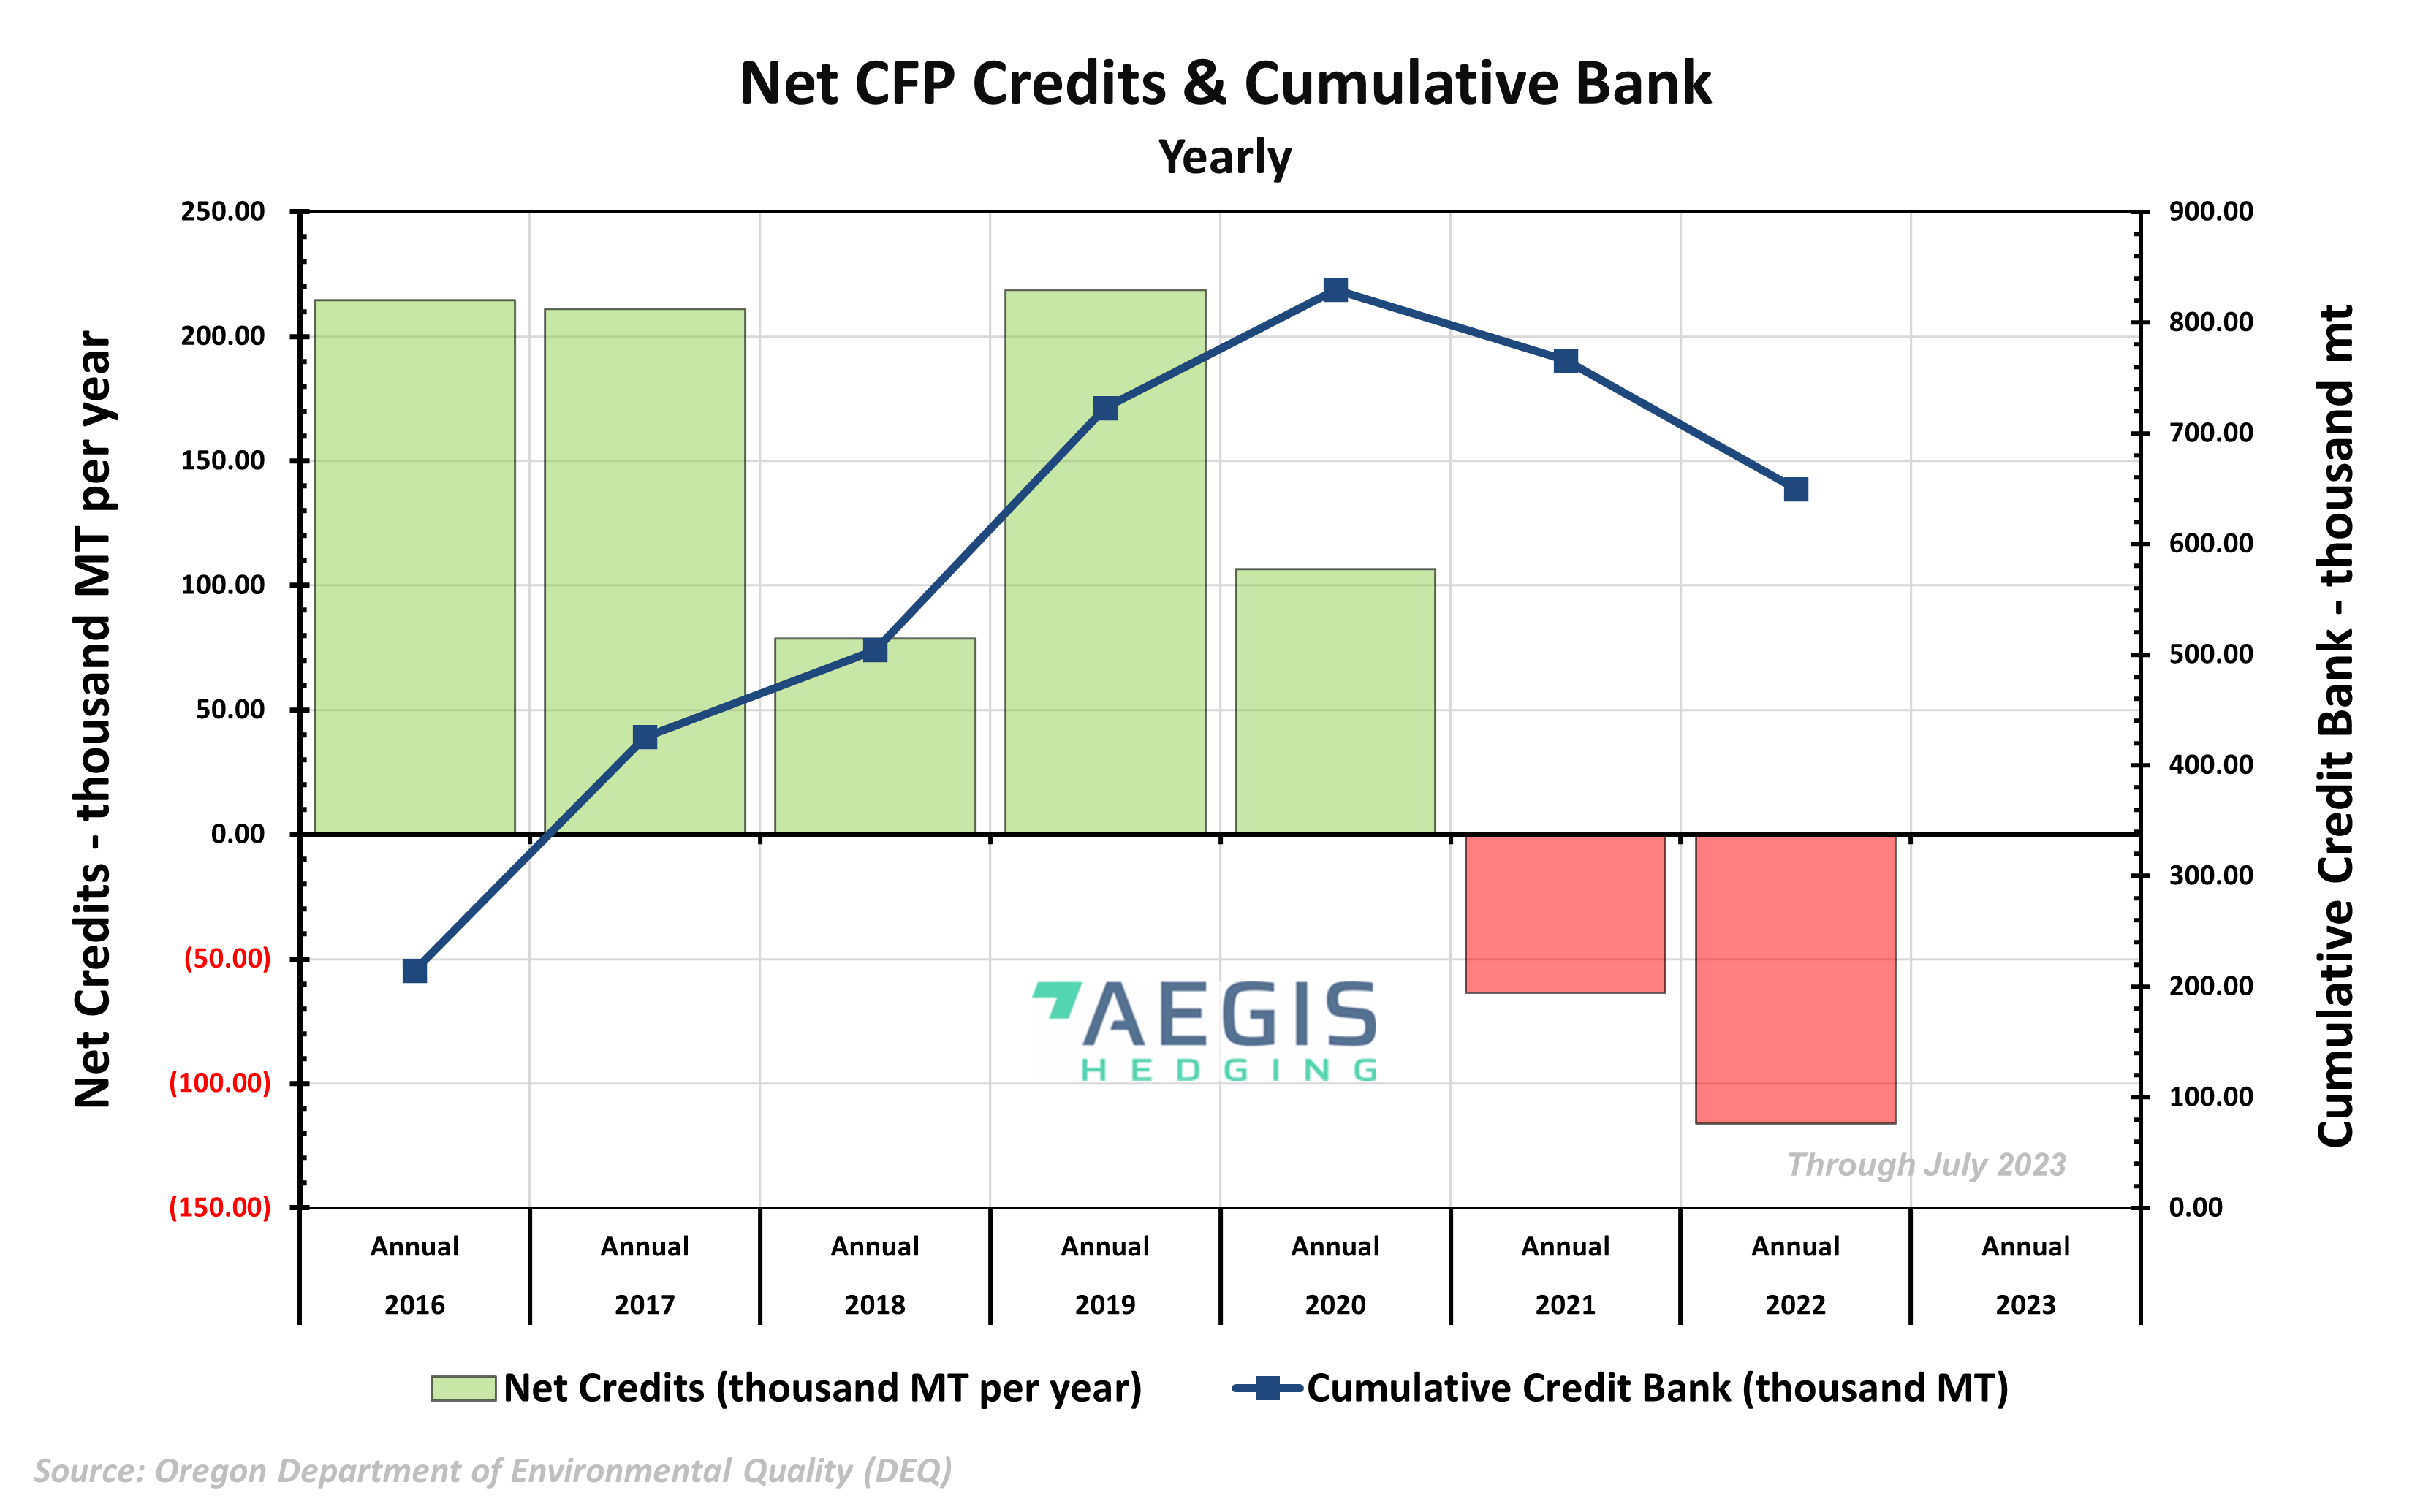
- Oregon DEQ reported a transfer volume of an estimated 102,570 metric tons in September 2023, down 46% from the previous month. September saw 23 transfers with an average transfer price of $141.94/credit, up by 3% from August’s $137.93. This marks the highest transfer price in more than two and half years.
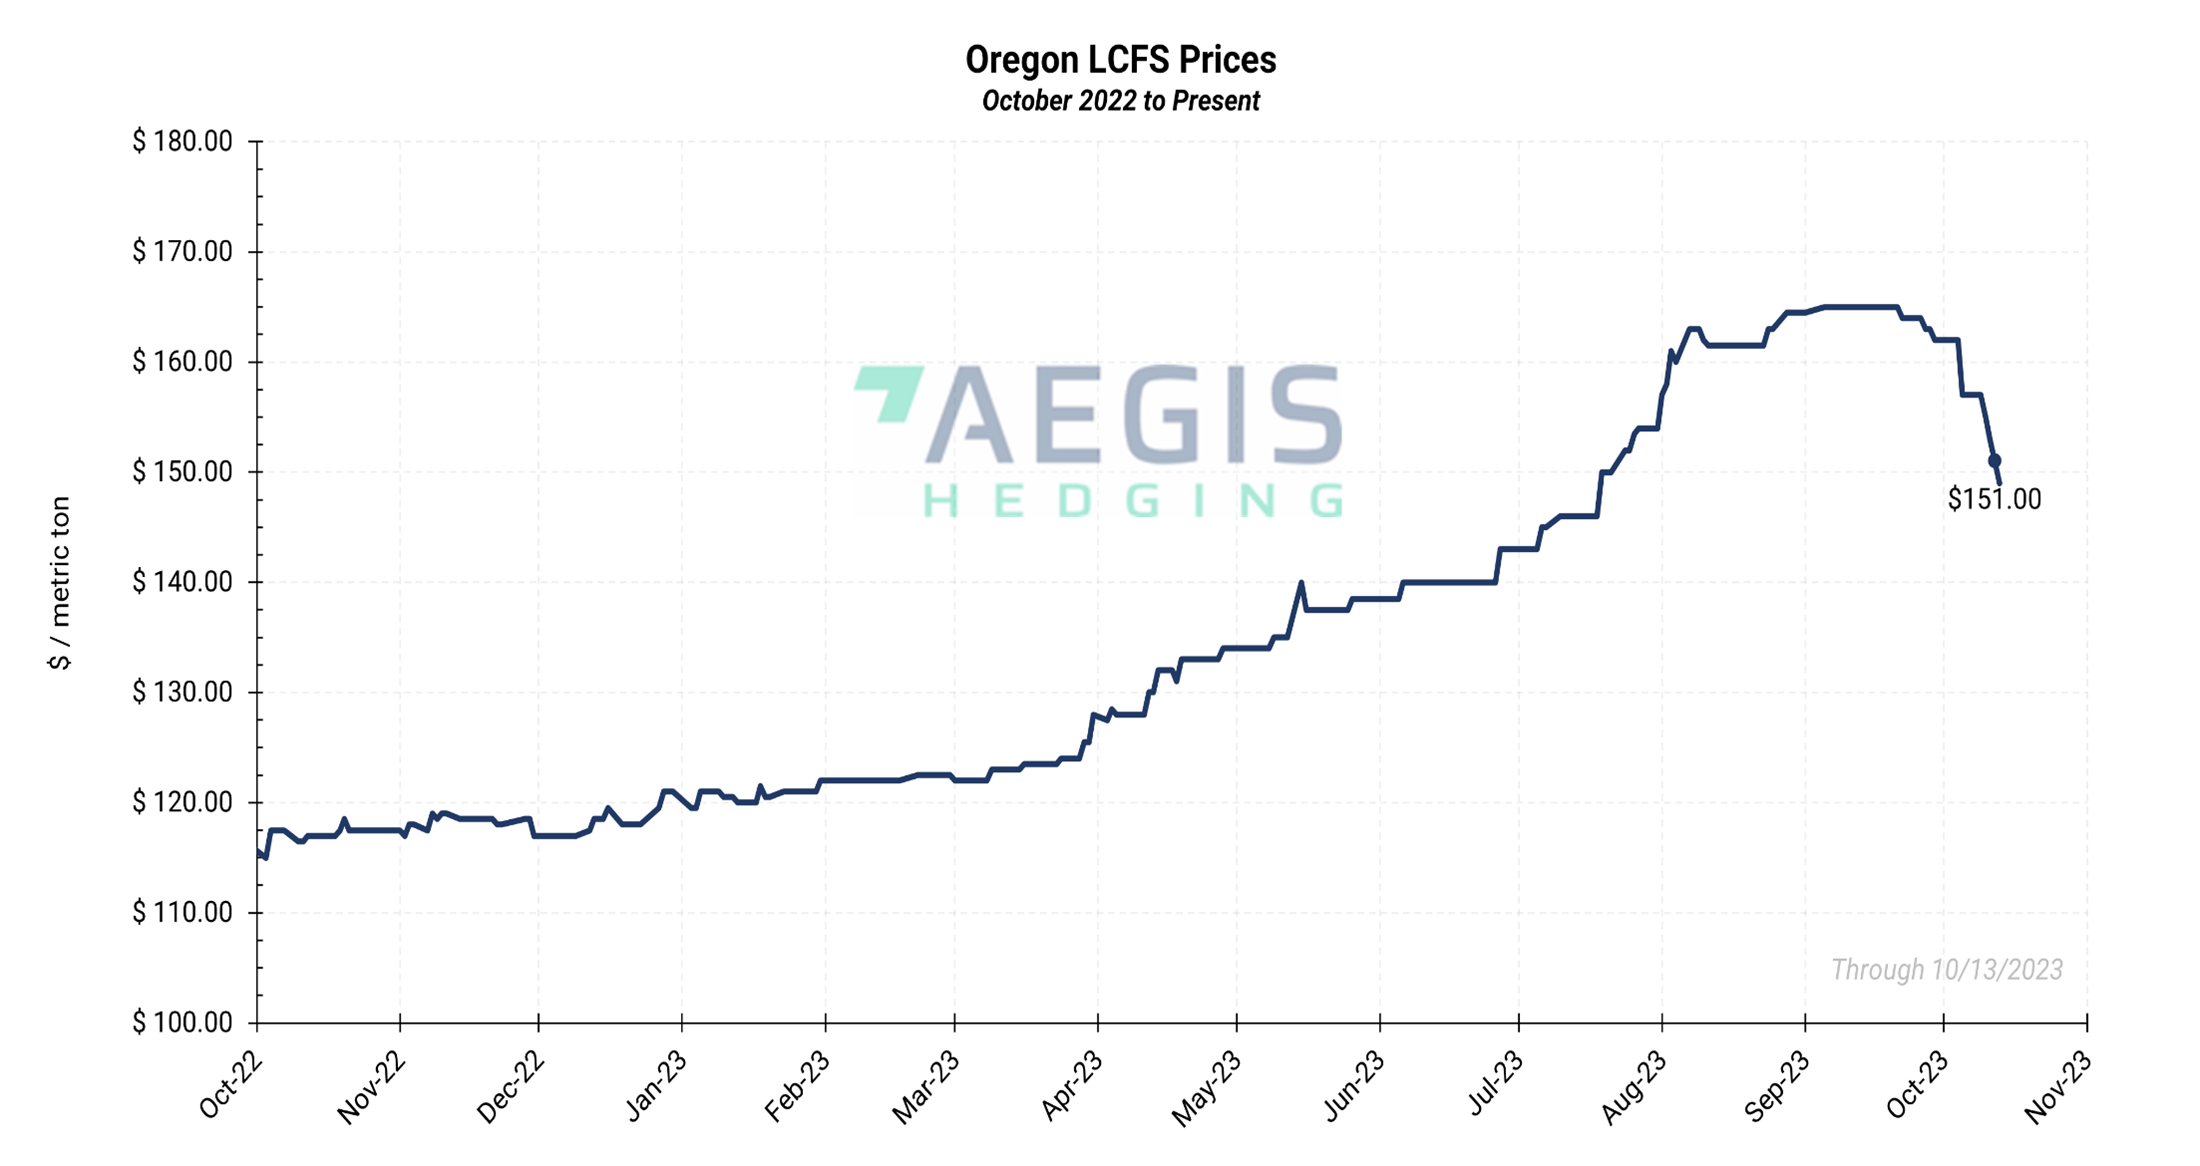
- Oregon LCFS credits traded higher over the month of August, starting at $157.00 and nearing a four-year high of $164.50 by the close of the month. Prices in the first half of September reached as high as $165.00/t, the highest level since August 29, 2019.
- Based on the most recent CARB calculations, the California LCFS maximum credit price is now $253.53/t. as of June 1, 2023, up from the 2022 maximum of $239.18/t. LCFS maximum credit prices are determined by a $200/t cap in 2016 dollars adjusted by a consumer price index.
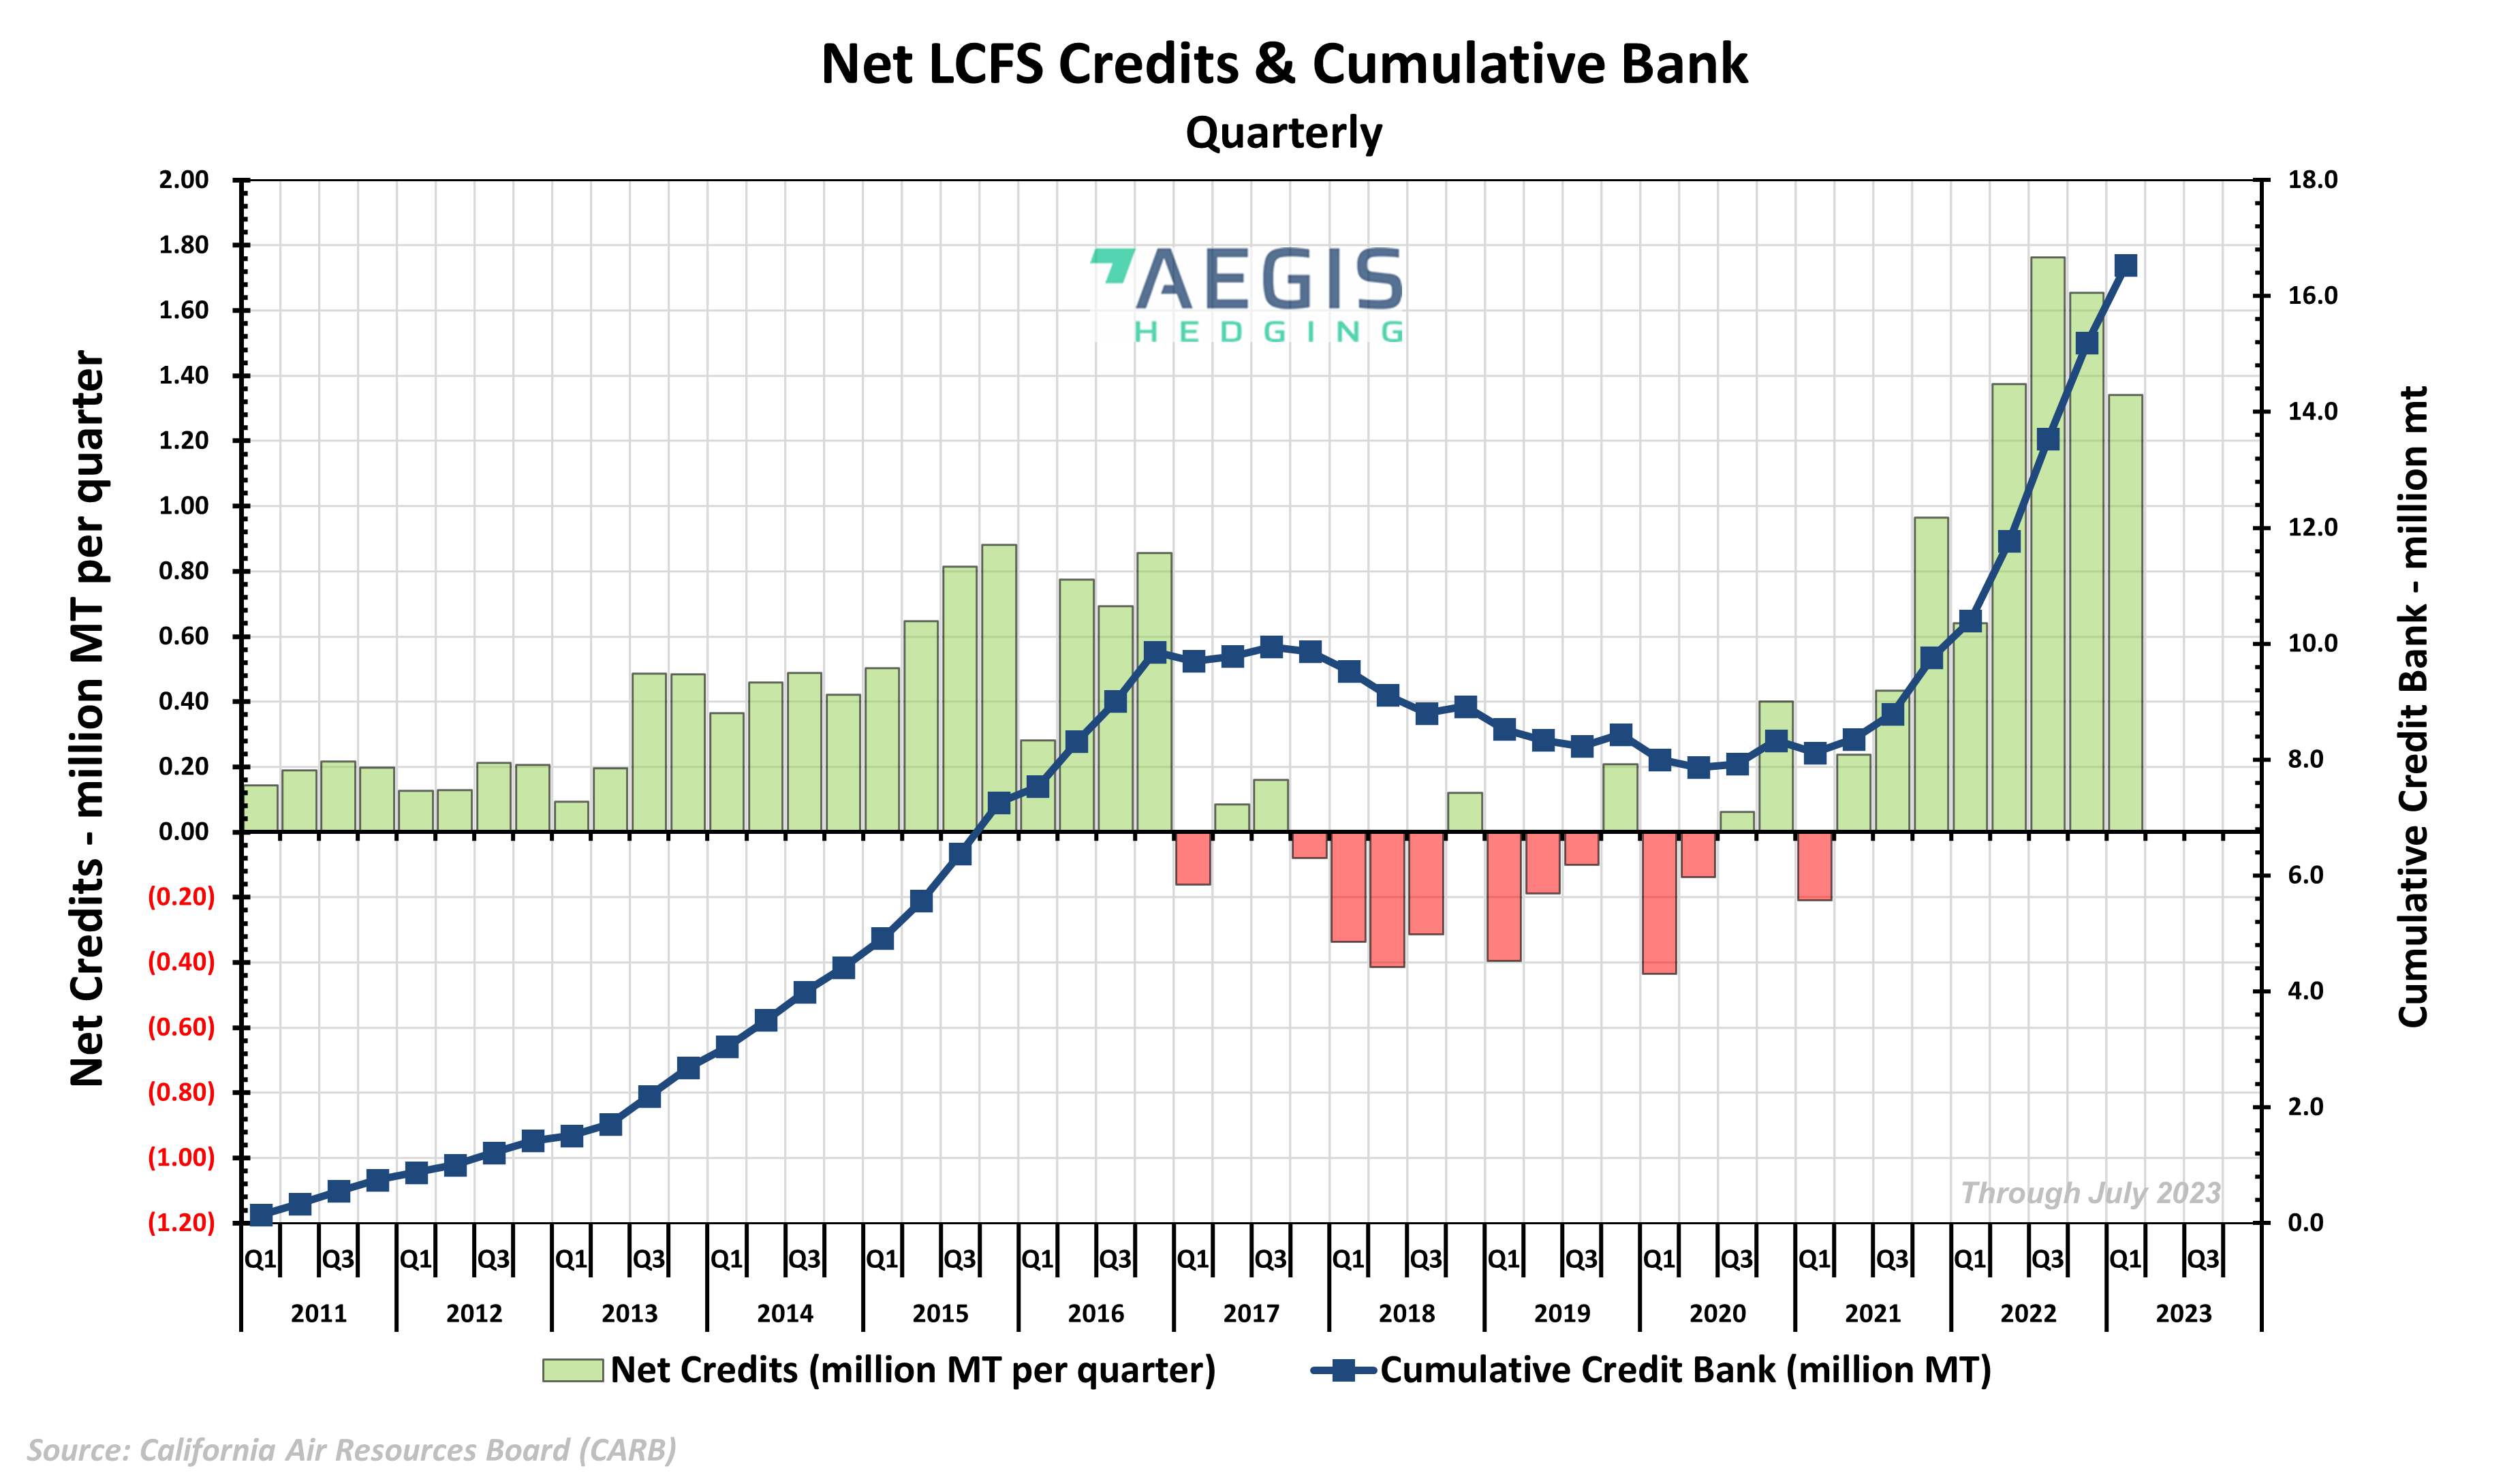
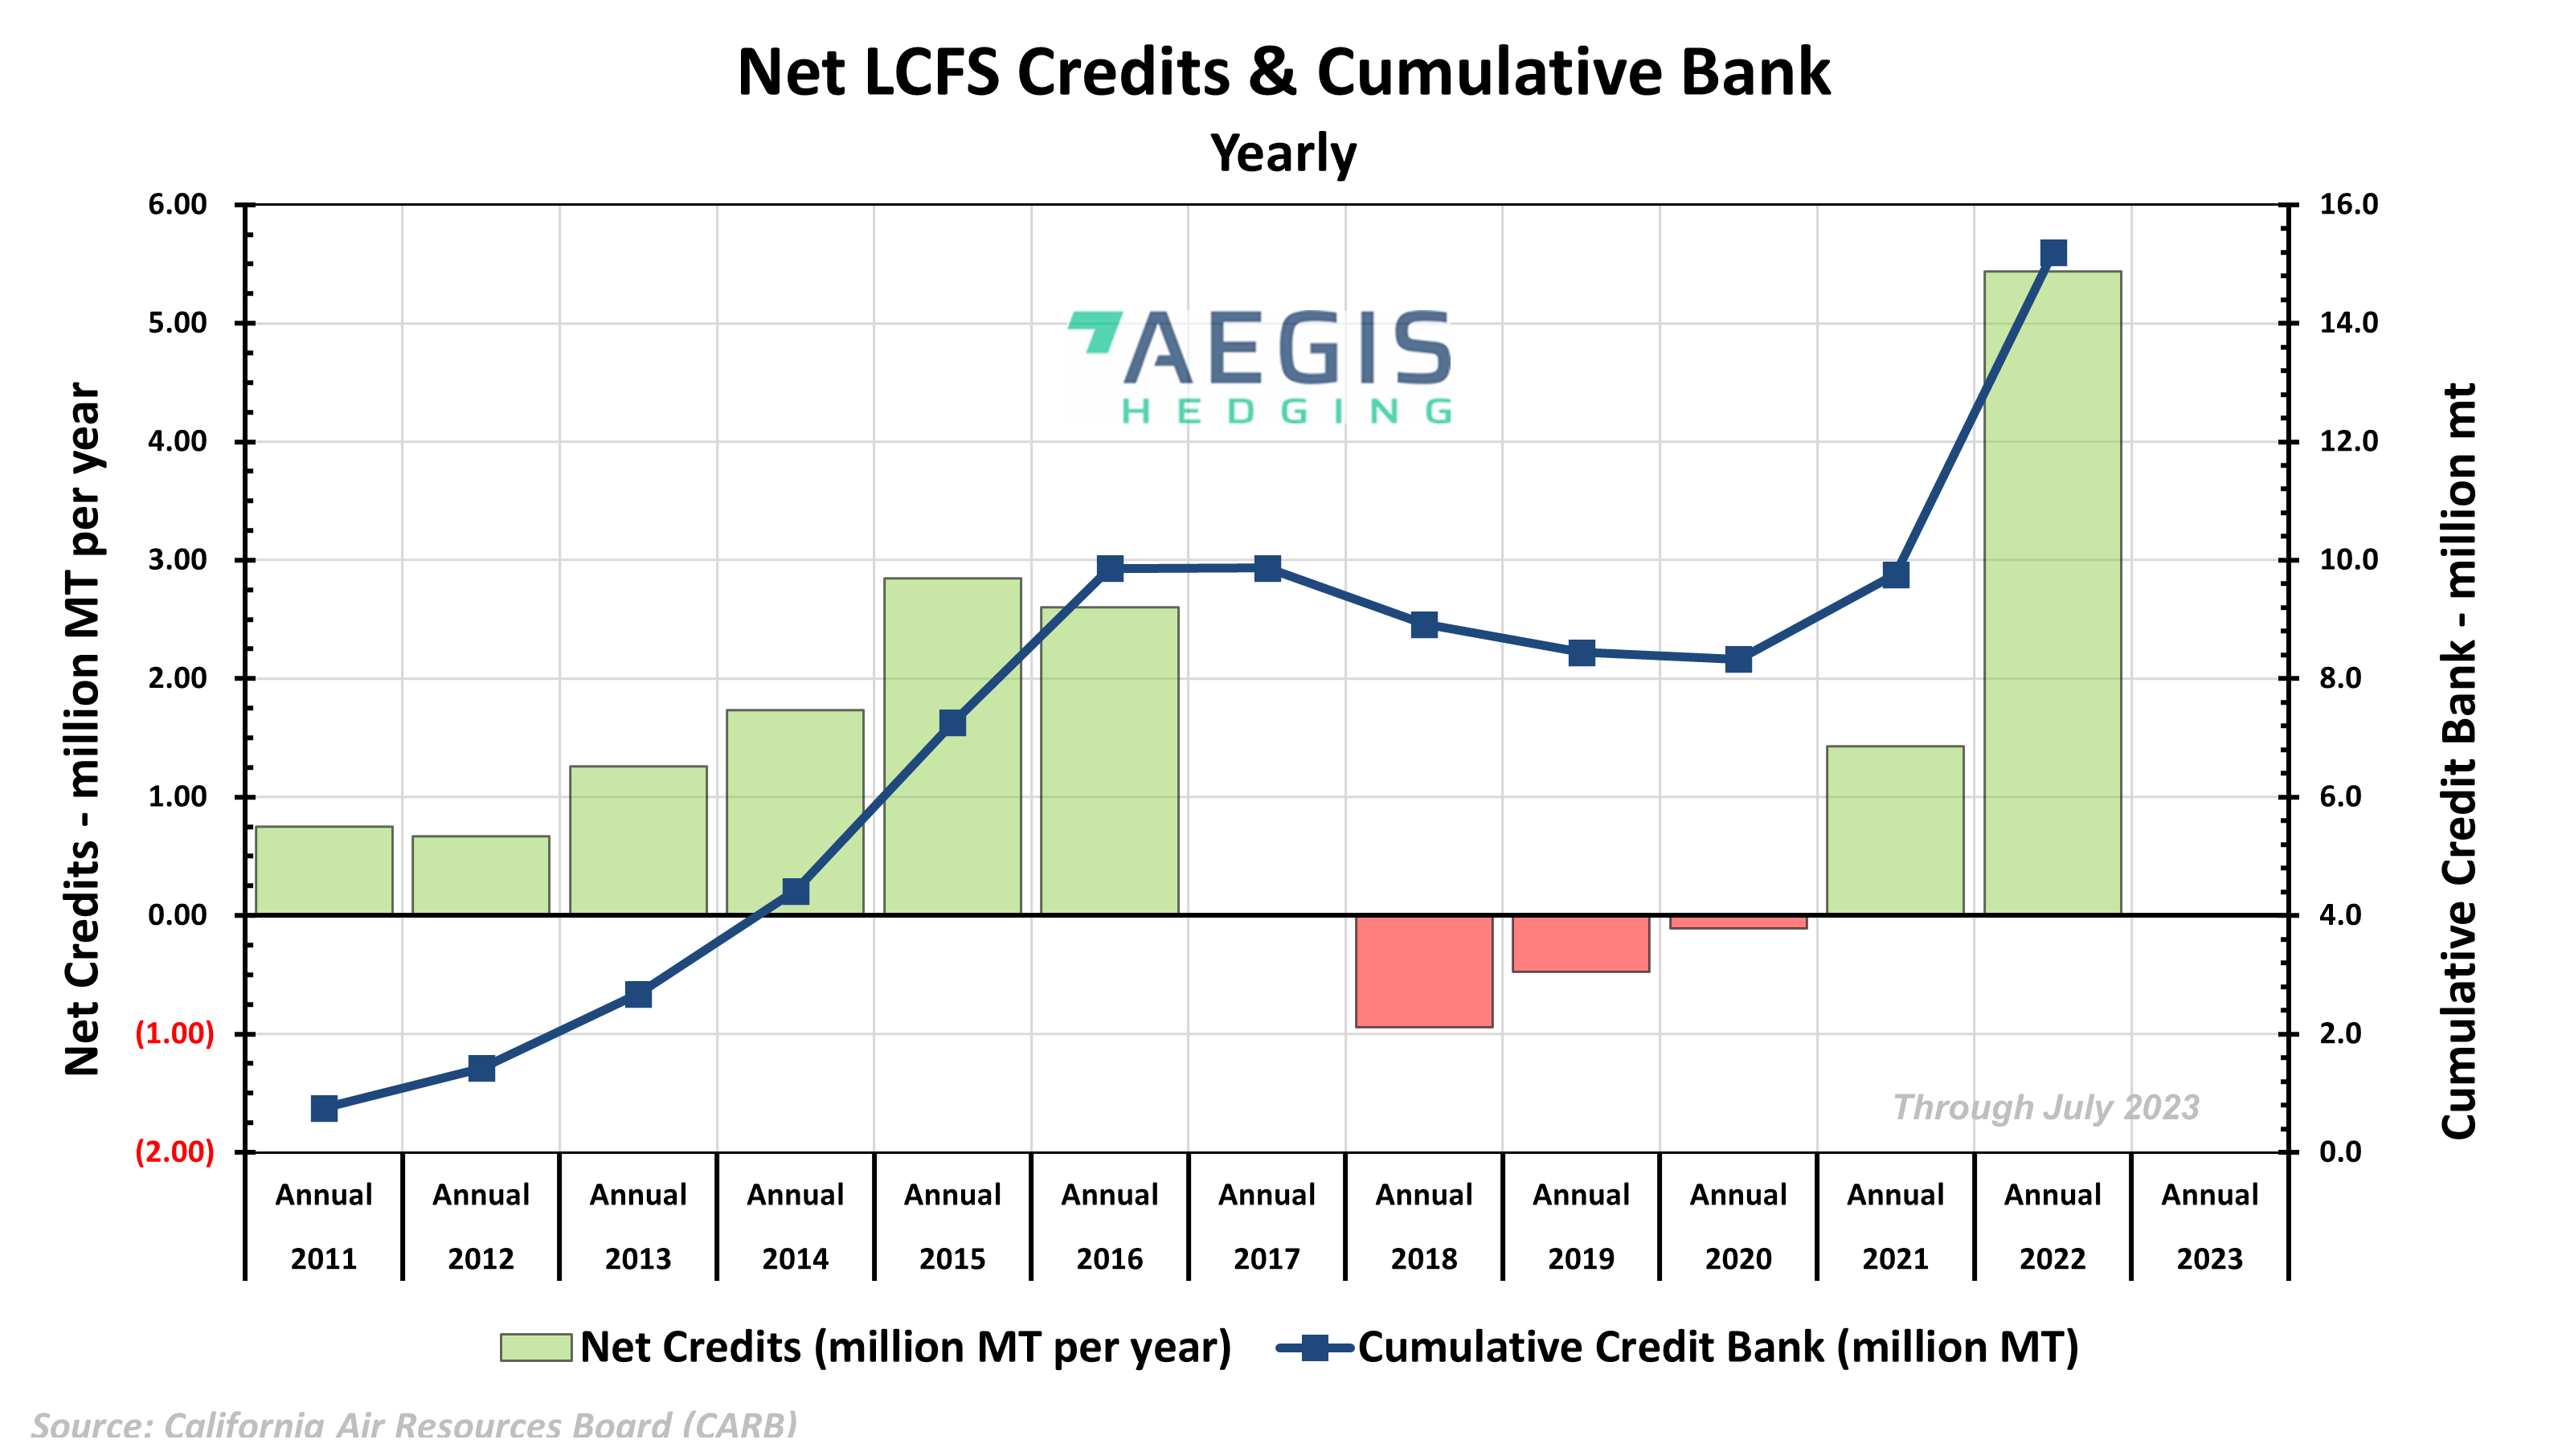
- The California LCFS market remains acutely oversupplied with the bank of available credits at its highest levels in program history and credits outpacing deficits by an increasing gap since July 2020. Oversupply saw prompt prices bottom at $59.00/t earlier this year, while the slow pace of regulatory reform looks poised to heavily pressure credits for the remainder of the year.
LCFS & CFP Schedule
| California LCFS Q2 2023 Reporting Deadline |
September 30th, 2023 |
|
|
|
|
|
|
|
| California LCFS Q2 2023 Data Release |
October 31st, 2023 |
|
|
|
|
|
|
|
| California LCFS Q3 2023 Reporting Deadline |
December 30th, 2023 |
|
|
|
|
|
|
|
|
|
|
|
|
LCFS Credit & Futures Pricing
| Credit Prices as of October 16th, 2023: |
California Futures Prices as of October 16th, 2023: |
- California - Spot Delivery: $ 67.00
|
|
- Oregon - Spot Delivery: $ 145.00
|
|
- Washington - Spot Delivery: $ 64.00
|
|
LCFS Cost for Gasoline and Diesel
|
California, as of October 16th, 2023:
|
Oregon, as of October 16th, 2023:
|
- CARBOB (No Cl ethanol) - Vintage 2023: 9.06 cents per gallon
|
- E10 gasoline - Vintage 2023: 10.95 cents per gallon
|
- CARBOB (79.9 Cl ethanol) - Vintage 2023: 8.60 cents per gallon
|
- B5 diesel – Vintage 2023: 12.48 cents per gallon
|
Monthly Credit Transfer Activity for California
|
Time
|
Transfers
|
Total Volume
|
Avg $/credit
|
|
23-Sep
|
233
|
1,033,000
|
$73
|
|
23-Aug
|
168
|
2,044,000
|
$77
|
|
23-Jul
|
417
|
4,347,000
|
$75
|
| 23-Jun |
222 |
2,470,000 |
$79 |
| 23-May |
158 |
1,684,000 |
$81 |
| 23-Apr |
547 |
5,596,000 |
$74 |
|
23-Mar
|
252
|
2,702,000
|
$73
|
|
23-Feb
|
161
|
1,293,000
|
$71
|
|
23-Jan
|
470
|
4,564,000
|
$81
|
|
22-Dec
|
292
|
3,001,000
|
$86
|
|
22-Nov
|
181
|
2,379,000
|
$81
|
|
22-Oct
|
555
|
5,005,000
|
$106
|
|
22-Sep
|
179
|
1,759,000
|
$102
|
|
CY 2022
|
3,137
|
30,641,000
|
$125
|
|
CY 2021
|
2,664
|
25,279,000
|
$187
|
|
CY 2020
|
2,461
|
21,728,000
|
$199
|
|
CY 2019
|
1,656
|
14,146,000
|
$192
|
|
CY 2018
|
1725
|
13,334,000
|
$160
|
|
CY 2017
|
1226
|
8,875,000
|
$89
|
|
CY 2016
|
929
|
5,343,000
|
$101
|
|
CY 2015
|
578
|
2,852,000
|
$62
|
|
CY 2014
|
304
|
1,667,000
|
$31
|
|
CY 2013
|
202
|
887,000
|
$55
|
Source: https://ww2.arb.ca.gov/resources/documents/monthly-lcfs-credit-transfer-activity-reports
Monthly Credit Transfer Activity for Oregon
|
Time
|
Transfers
|
Total Volume
|
Avg $/credit
|
| 23- Sep |
23 |
102,570 |
$141.94 |
| 23- Aug |
29 |
188,709 |
$137.33 |
| 23- Jul |
32 |
166,522 |
$137.93 |
| 23-Jun |
28 |
123,401 |
$130.21 |
| 23-May |
30 |
121,556 |
$131.04 |
|
23-Apr
|
69
|
322,461
|
$121.73
|
|
23-Mar
|
50
|
345,944
|
$118.85
|
|
23-Feb
|
24
|
130,929
|
$119.73
|
|
23-Jan
|
41
|
212,109
|
$116.98
|
|
22-Dec
|
47
|
329,116
|
$118.02
|
|
22-Nov
|
24
|
132,299
|
$117.80
|
|
22-Oct
|
40
|
176,986
|
$115.55
|
|
22-Sep
|
35
|
215,128
|
$114.74
|
|
CY 2022
|
319
|
1,607,127
|
$119.01
|
|
CY 2021
|
245
|
1,035,306
|
$125.30
|
|
CY 2020
|
151
|
806,028
|
$128.08
|
Source: https://www.oregon.gov/deq/ghgp/cfp/Pages/Monthly-Data.aspx
Monthly Credit Transfer Activity for Washington
|
Time
|
Transfers
|
Total Volume
|
Avg $/credit
|
| 23- Sep |
20 |
51,322 |
$96.26 |
| 23- Aug |
4 |
27,055 |
$106.66 |
| 23-Jul |
0 |
0 |
- |
|
CY 2022
|
-
|
-
|
-
|
|
CY 2021
|
-
|
-
|
-
|
|
CY 2020
|
-
|
-
|
-
|
Source: https://ecology.wa.gov/air-climate/reducing-greenhouse-gas-emissions/clean-fuel-standard/data-reports
Figure 1. California LCFS Prompt USD/mt October 2022 - Present
|
|
|
|
|
2022 Average Daily Price: $ 98.35
|
2023 Average Daily Price: $ 73.72
|
|
2022 Highest Daily Price: $ 153.50
|
2023 Highest Daily Price: $ 86.00
|
|
(January 6th, 2022)
|
(May 9th, 2023)
|
|
|
Figure 2. Oregon LCFS Prompt USD/mt October 2022 – Present
|
|
|
|
|
2022 Average Daily Price: $ 117.85
|
2023 Average Daily Price: $ 133.98
|
|
2022 Highest Daily Price: $ 126.50
|
2023 Highest Daily Price: $ 163.00
|
|
(February 17th, 2022)
|
(August 9th, 2023)
|
|
|
Figure 3. Washington CFS Prompt USD/mt May 2023 – Present
|
|
|
2023 Average Daily Price: $ 103.06
|
|
2023 Highest Daily Price: $ 108.50
|
|
(July 19th, 2023)
|
|
|
Figure 4. California LCFS Net Credits & Cumulative Bank Volume - Quarterly
Figure 5. California LCFS Net Credits & Cumulative Bank Volume - Yearly
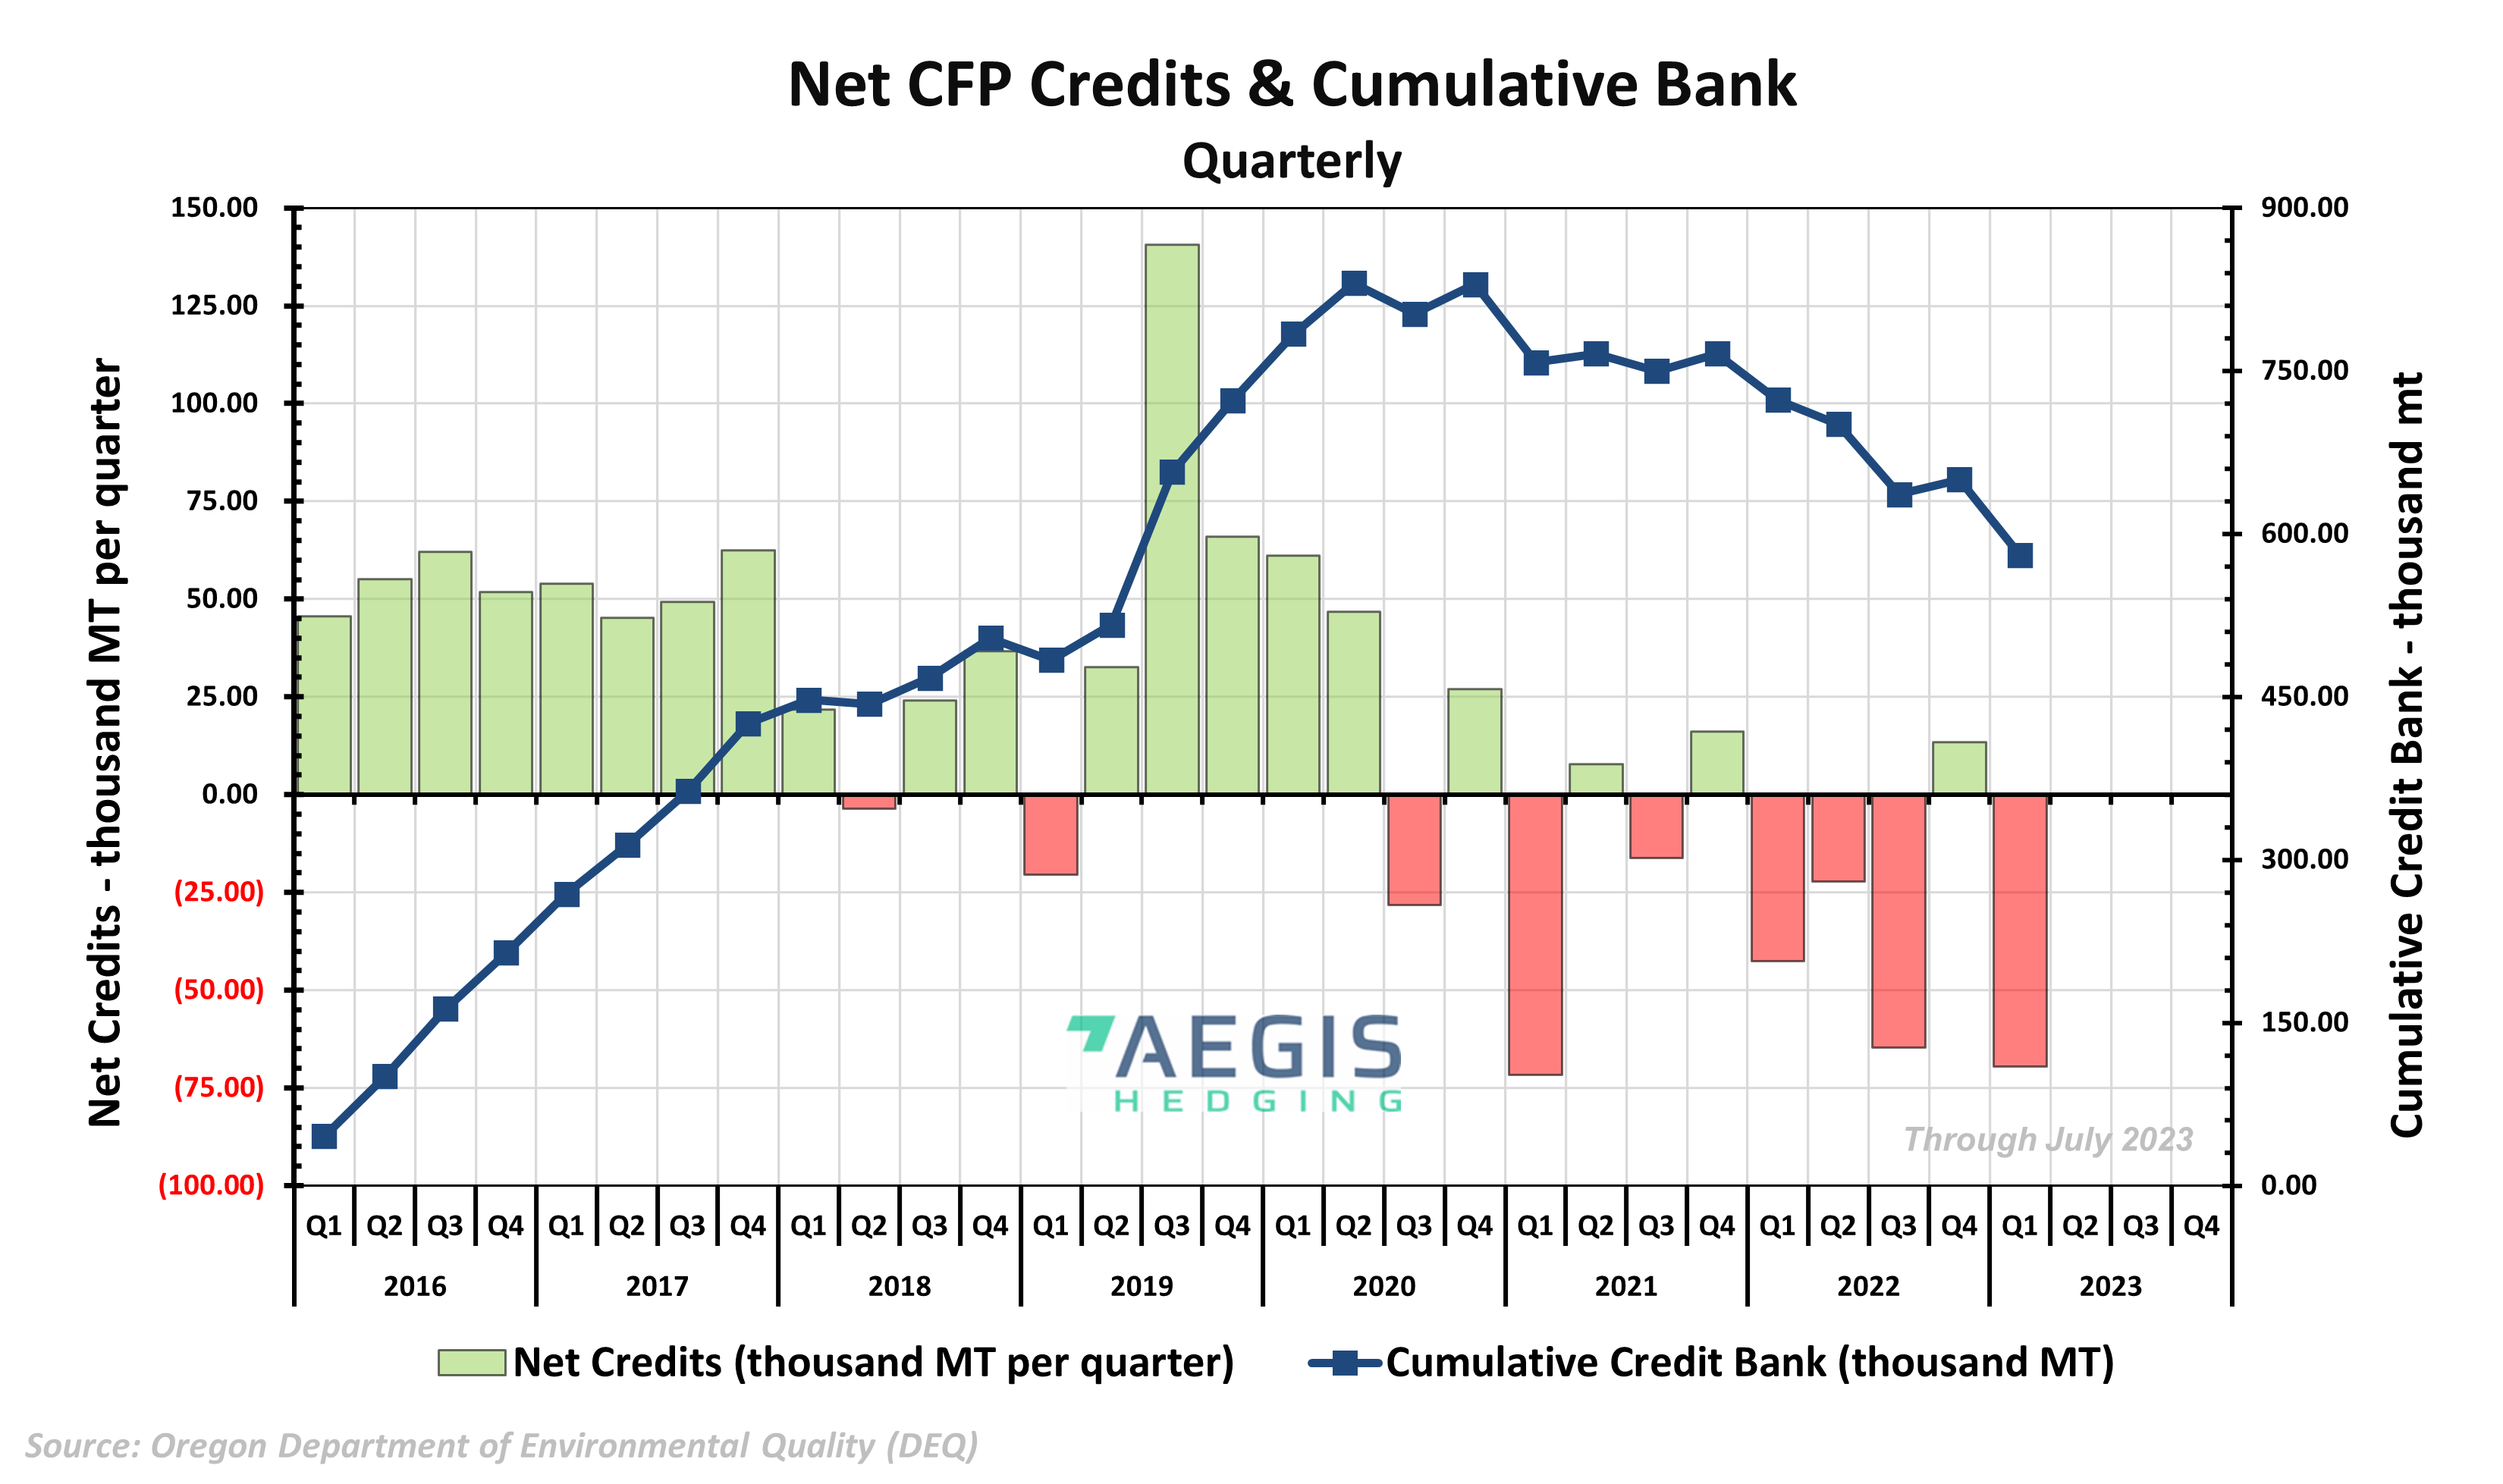
Figure 6. Oregon CFP Net Credits and Cumulative Bank Volume - Quarterly
Figure 7. Oregon CFP Net Credits and Cumulative Bank Volume - Yearly
Questions? Contact our team for more information: environmental@aegis-hedging.com
CONFIDENTIAL – UNAUTHORIZED THIRD-PARTY DISTRIBUTION PROHIBITED