Latest Insight
Last Look: Oil snaps its two-week losing streak, finishing $1.63 higher this week
|
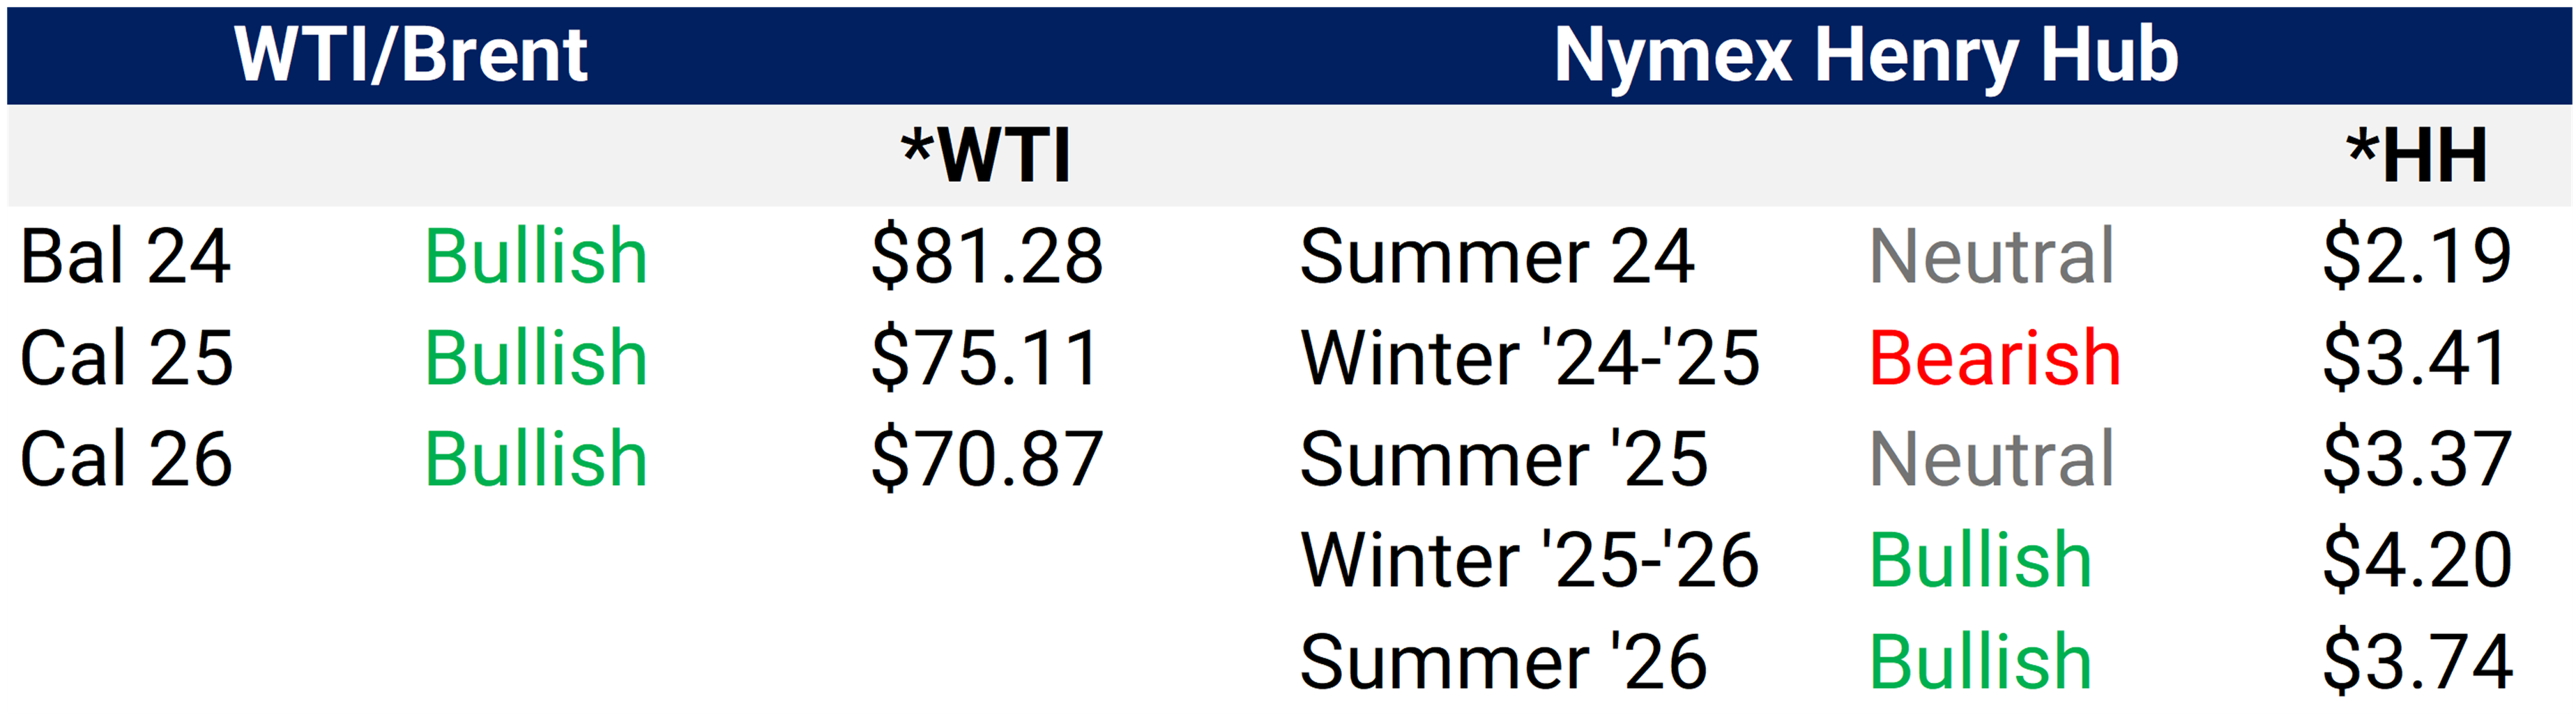
Our outlook above is a view of where specific prices will settle versus the curve. Bullish means we believe there are more chances the provided strip realizes above the current future or swap price. Bearish, just the opposite, implies more pressure on the current strip price to realize below future values. |
||
|
||
|
*The outlook, prices and all the charts are as of April 26, 2024 |
||
Natural Gas |
||
|
|
||
|
|
||
|
|
||
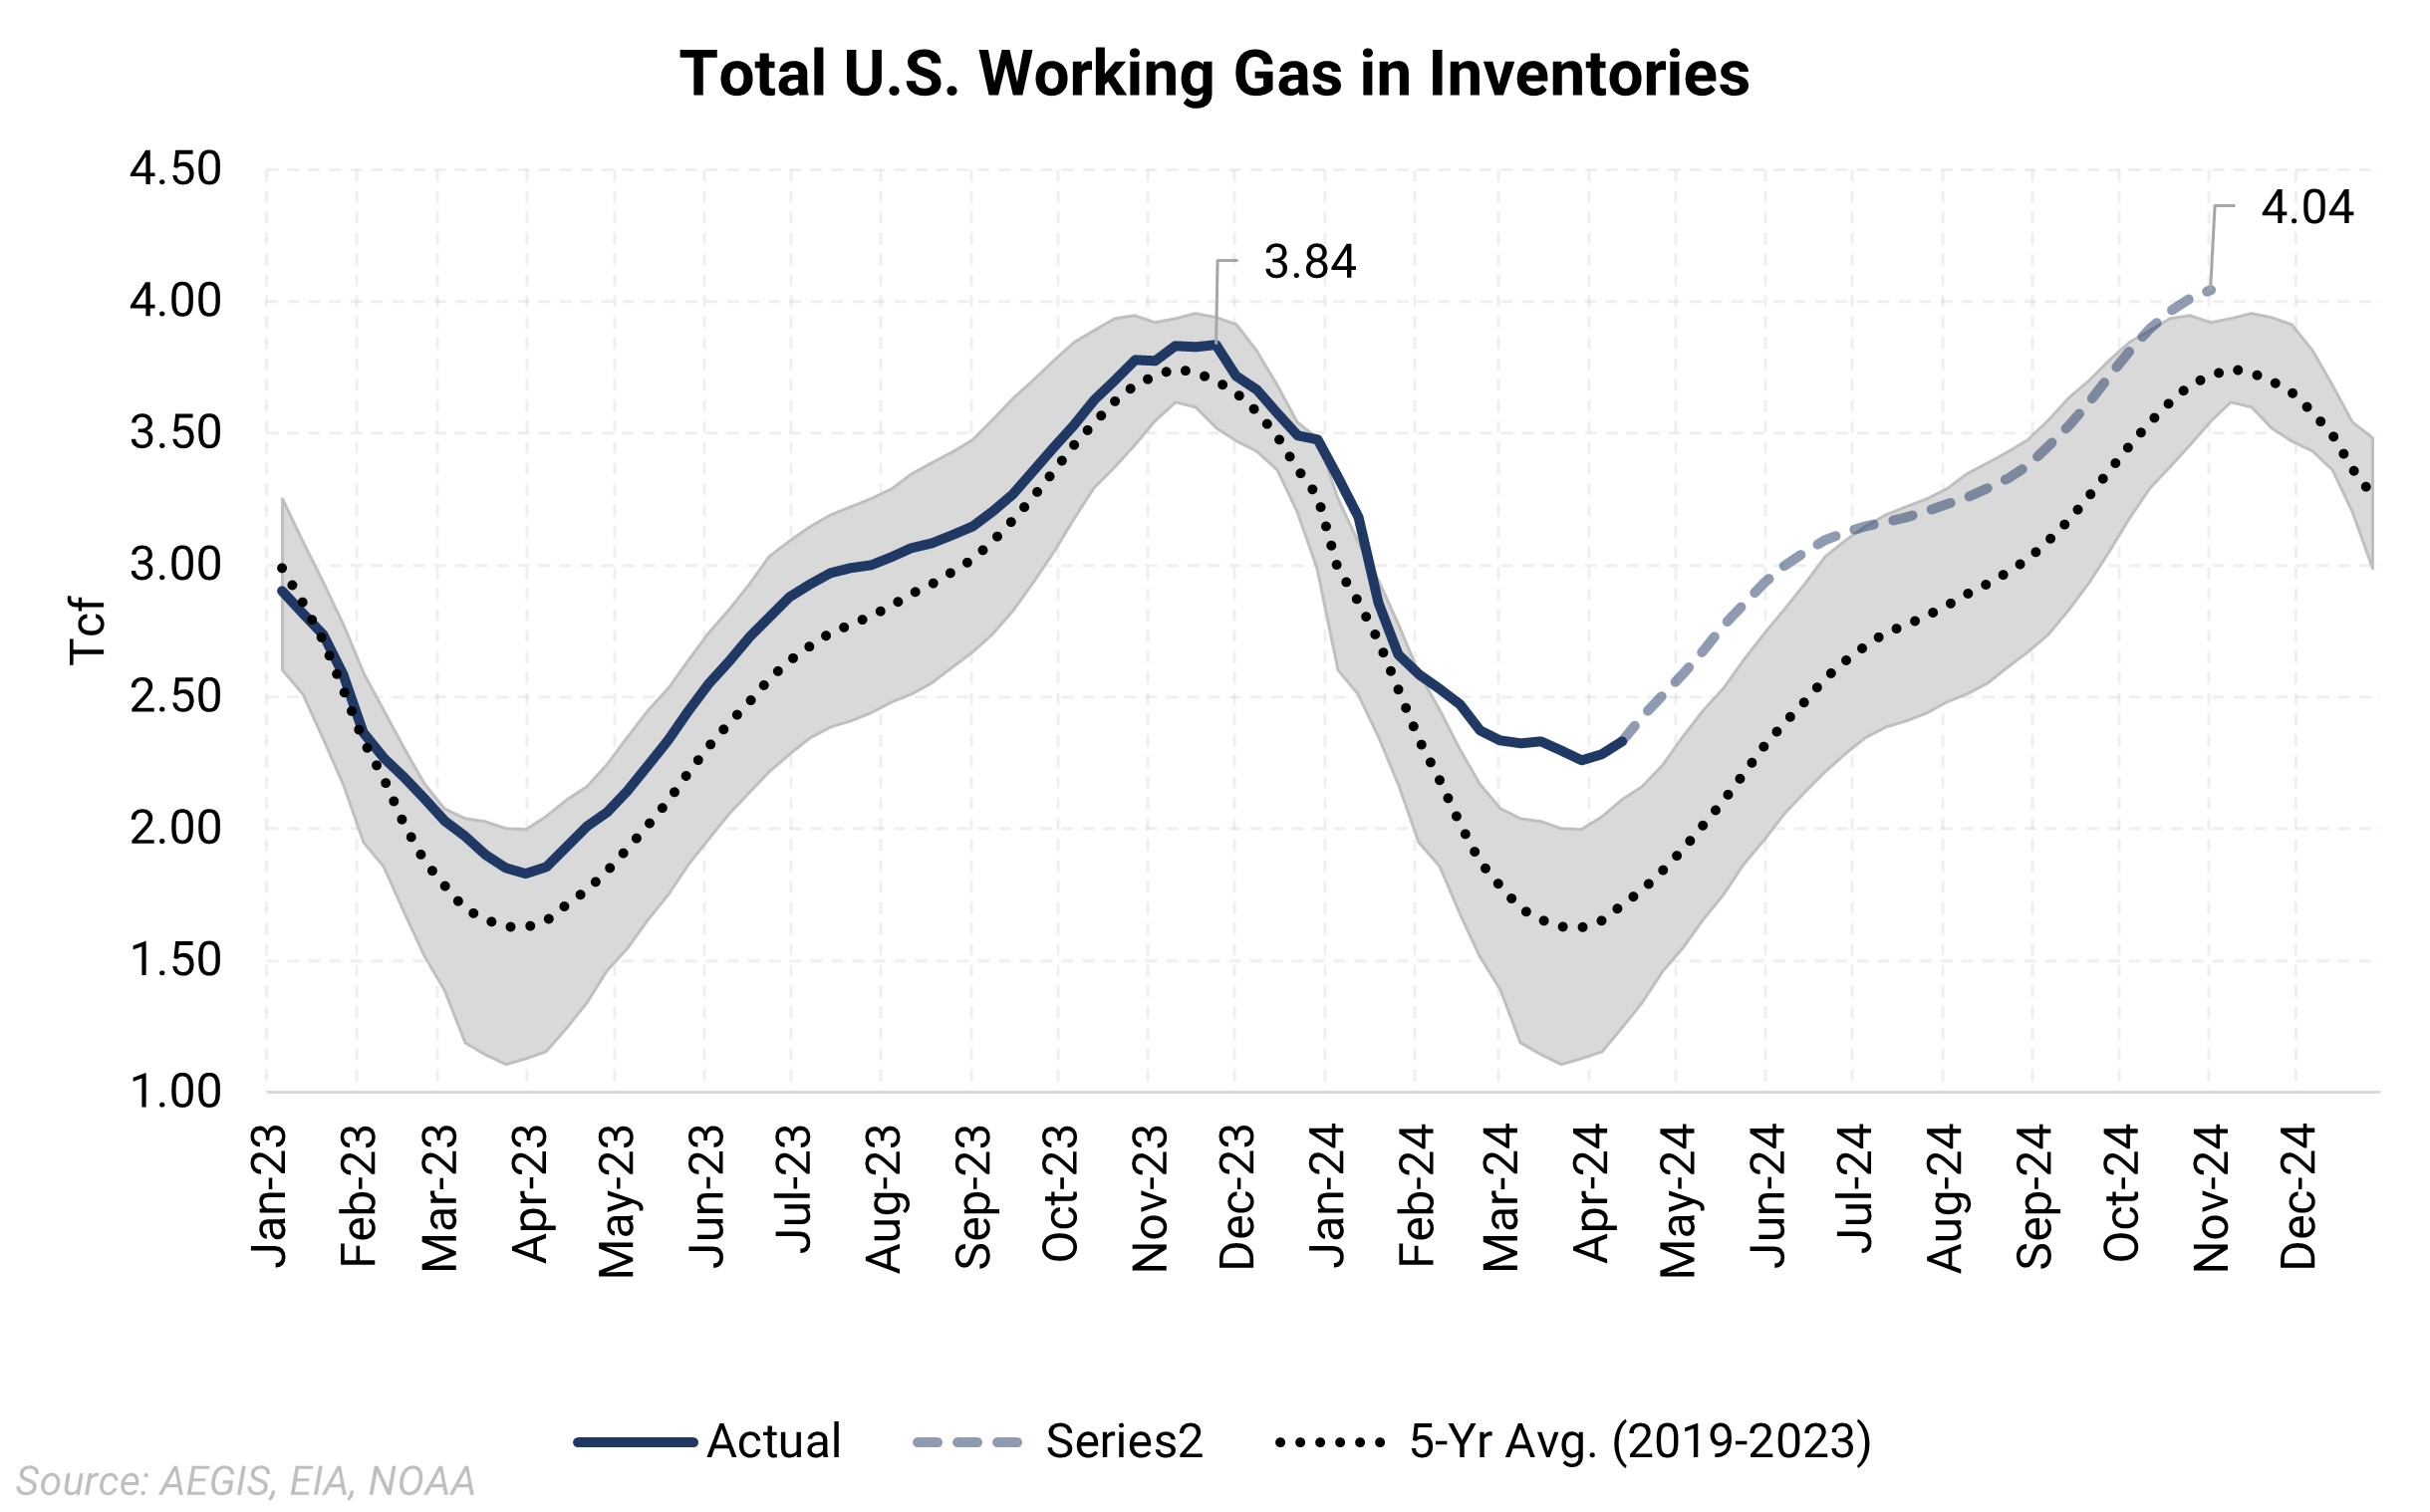
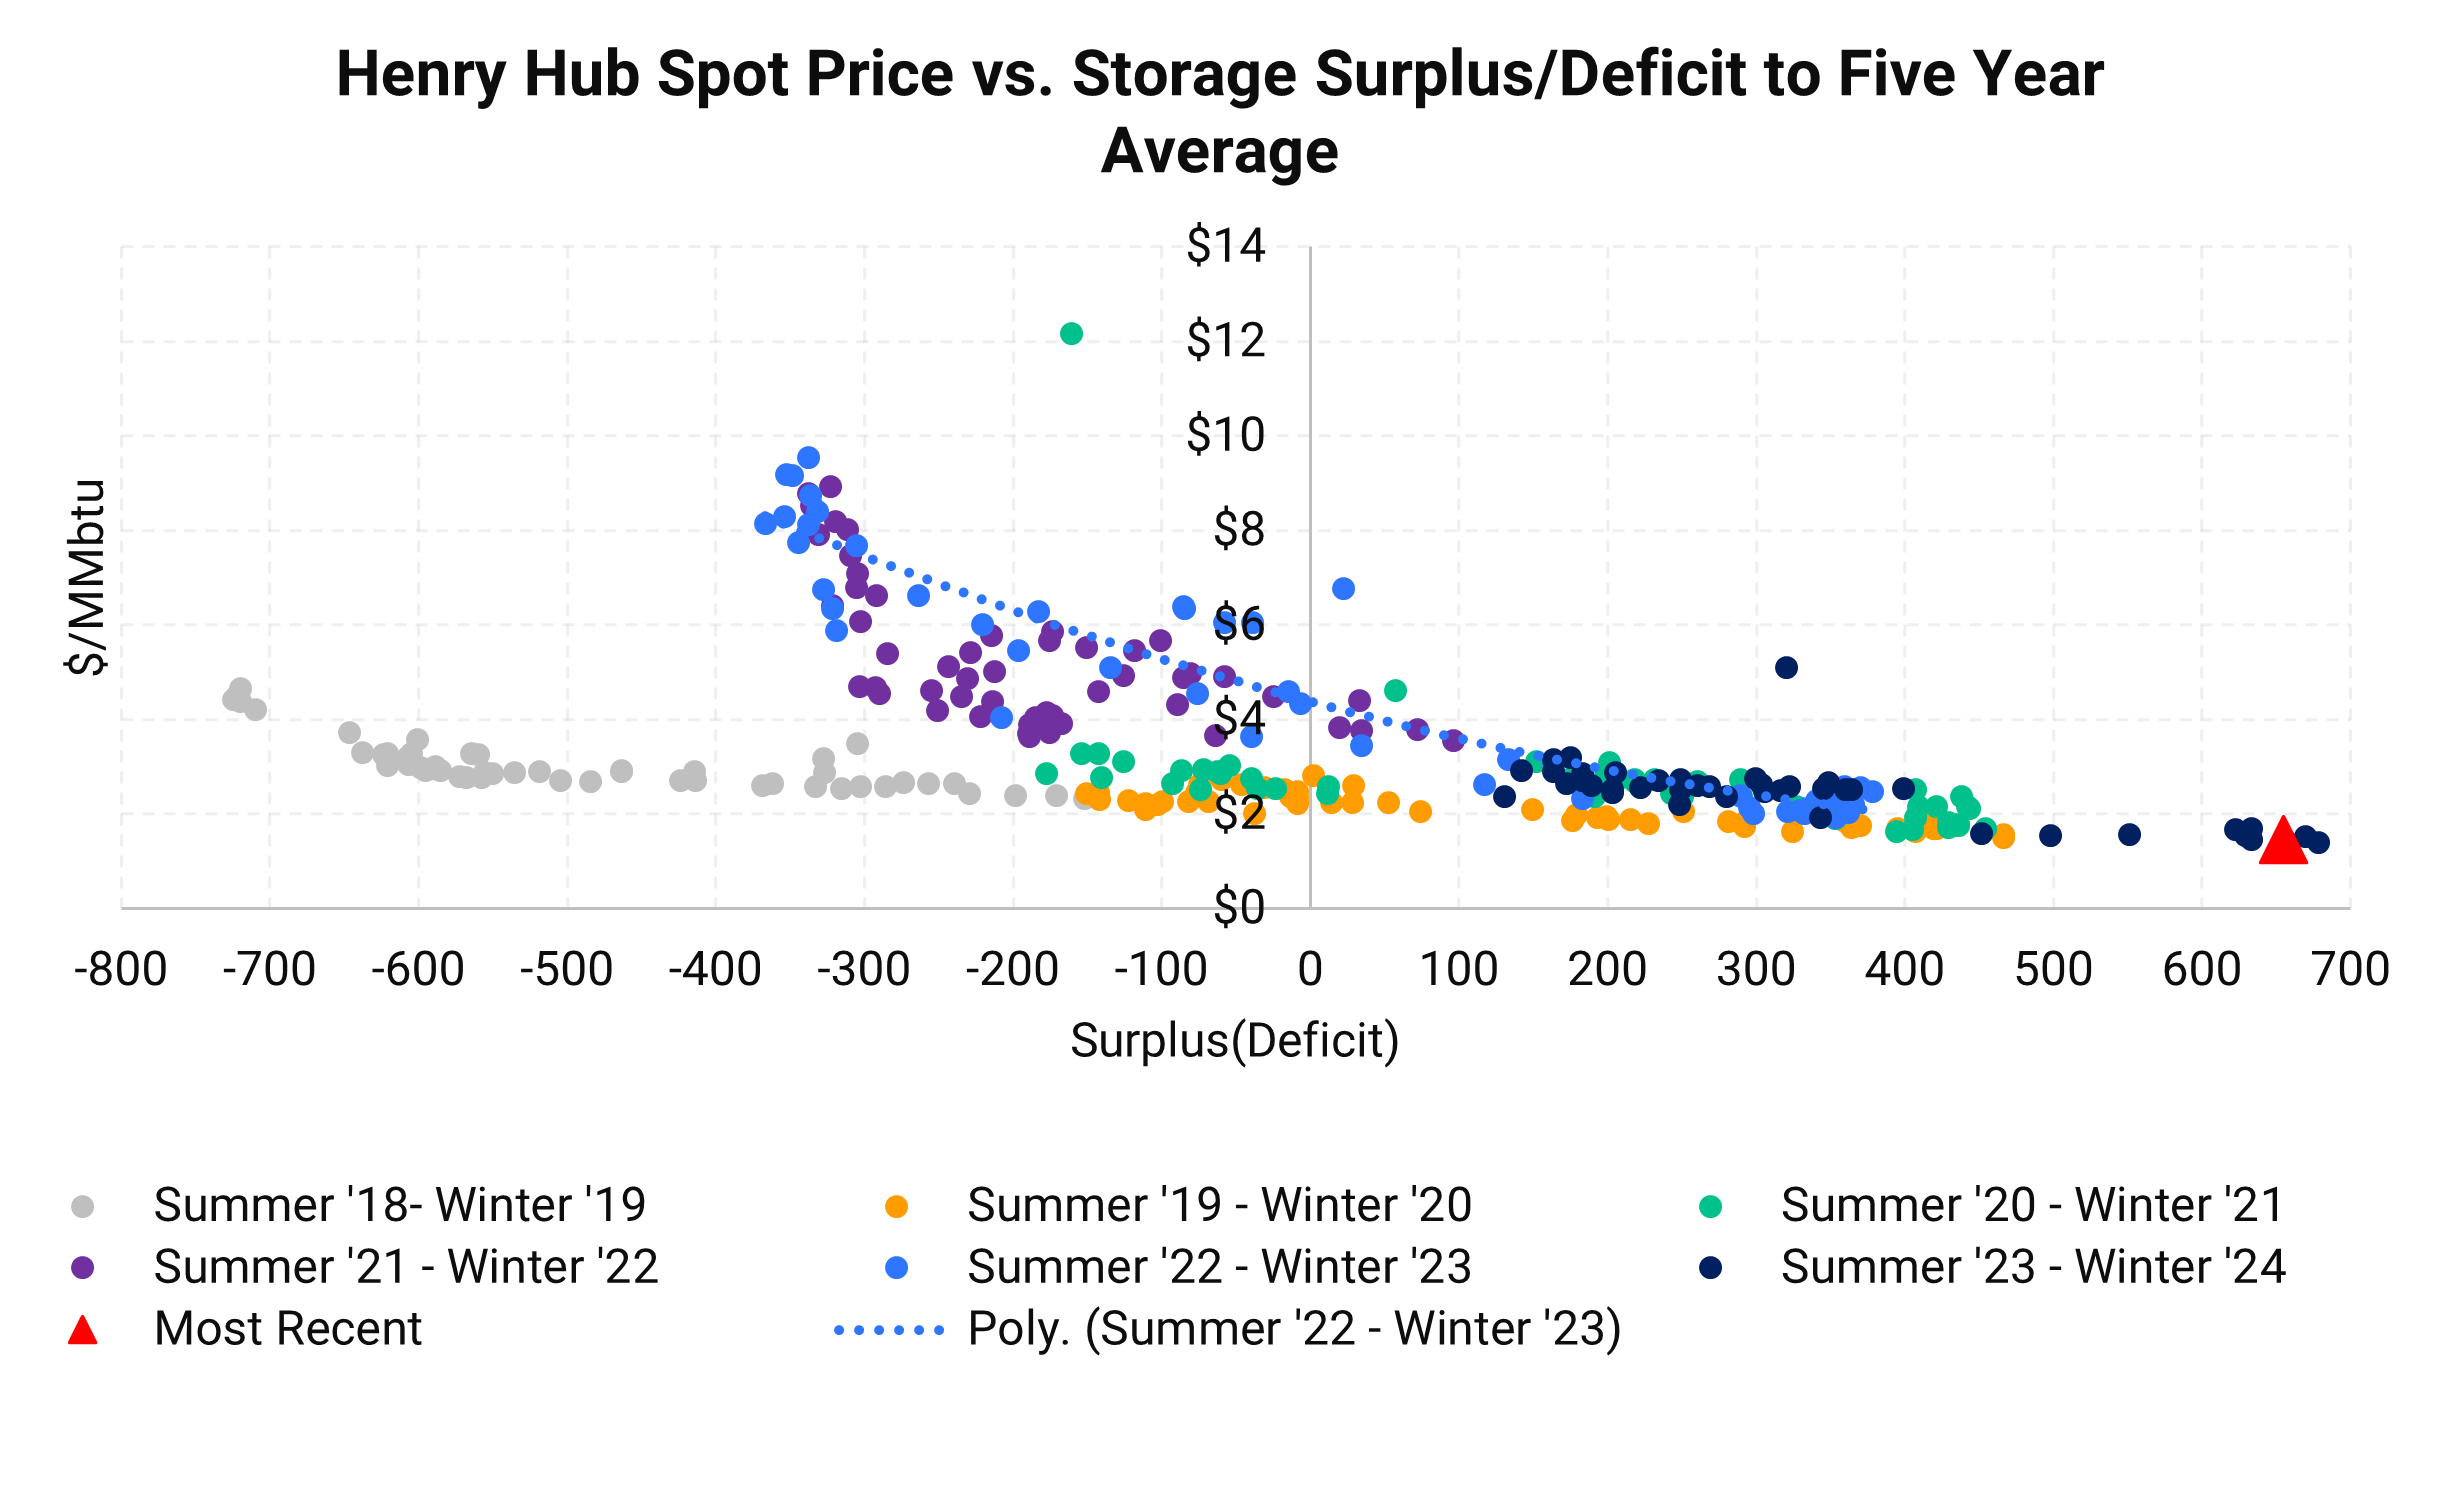
| U.S. gas inventories remain seasonally elevated. This week, the EIA reported a 50 Bcf build in the storage. The reported draw met analyst expectations but was below the seasonal norm. Storage levels in 2024 are set to stay oversupplied as fundamentals continue to look bearish. The storage path could land around 2 Tcf as the U.S. moves into the summer injection season. The carryout level of inventories before next winter is modeled at about 4 Tcf - a bearish setup. | ||
|
|
||
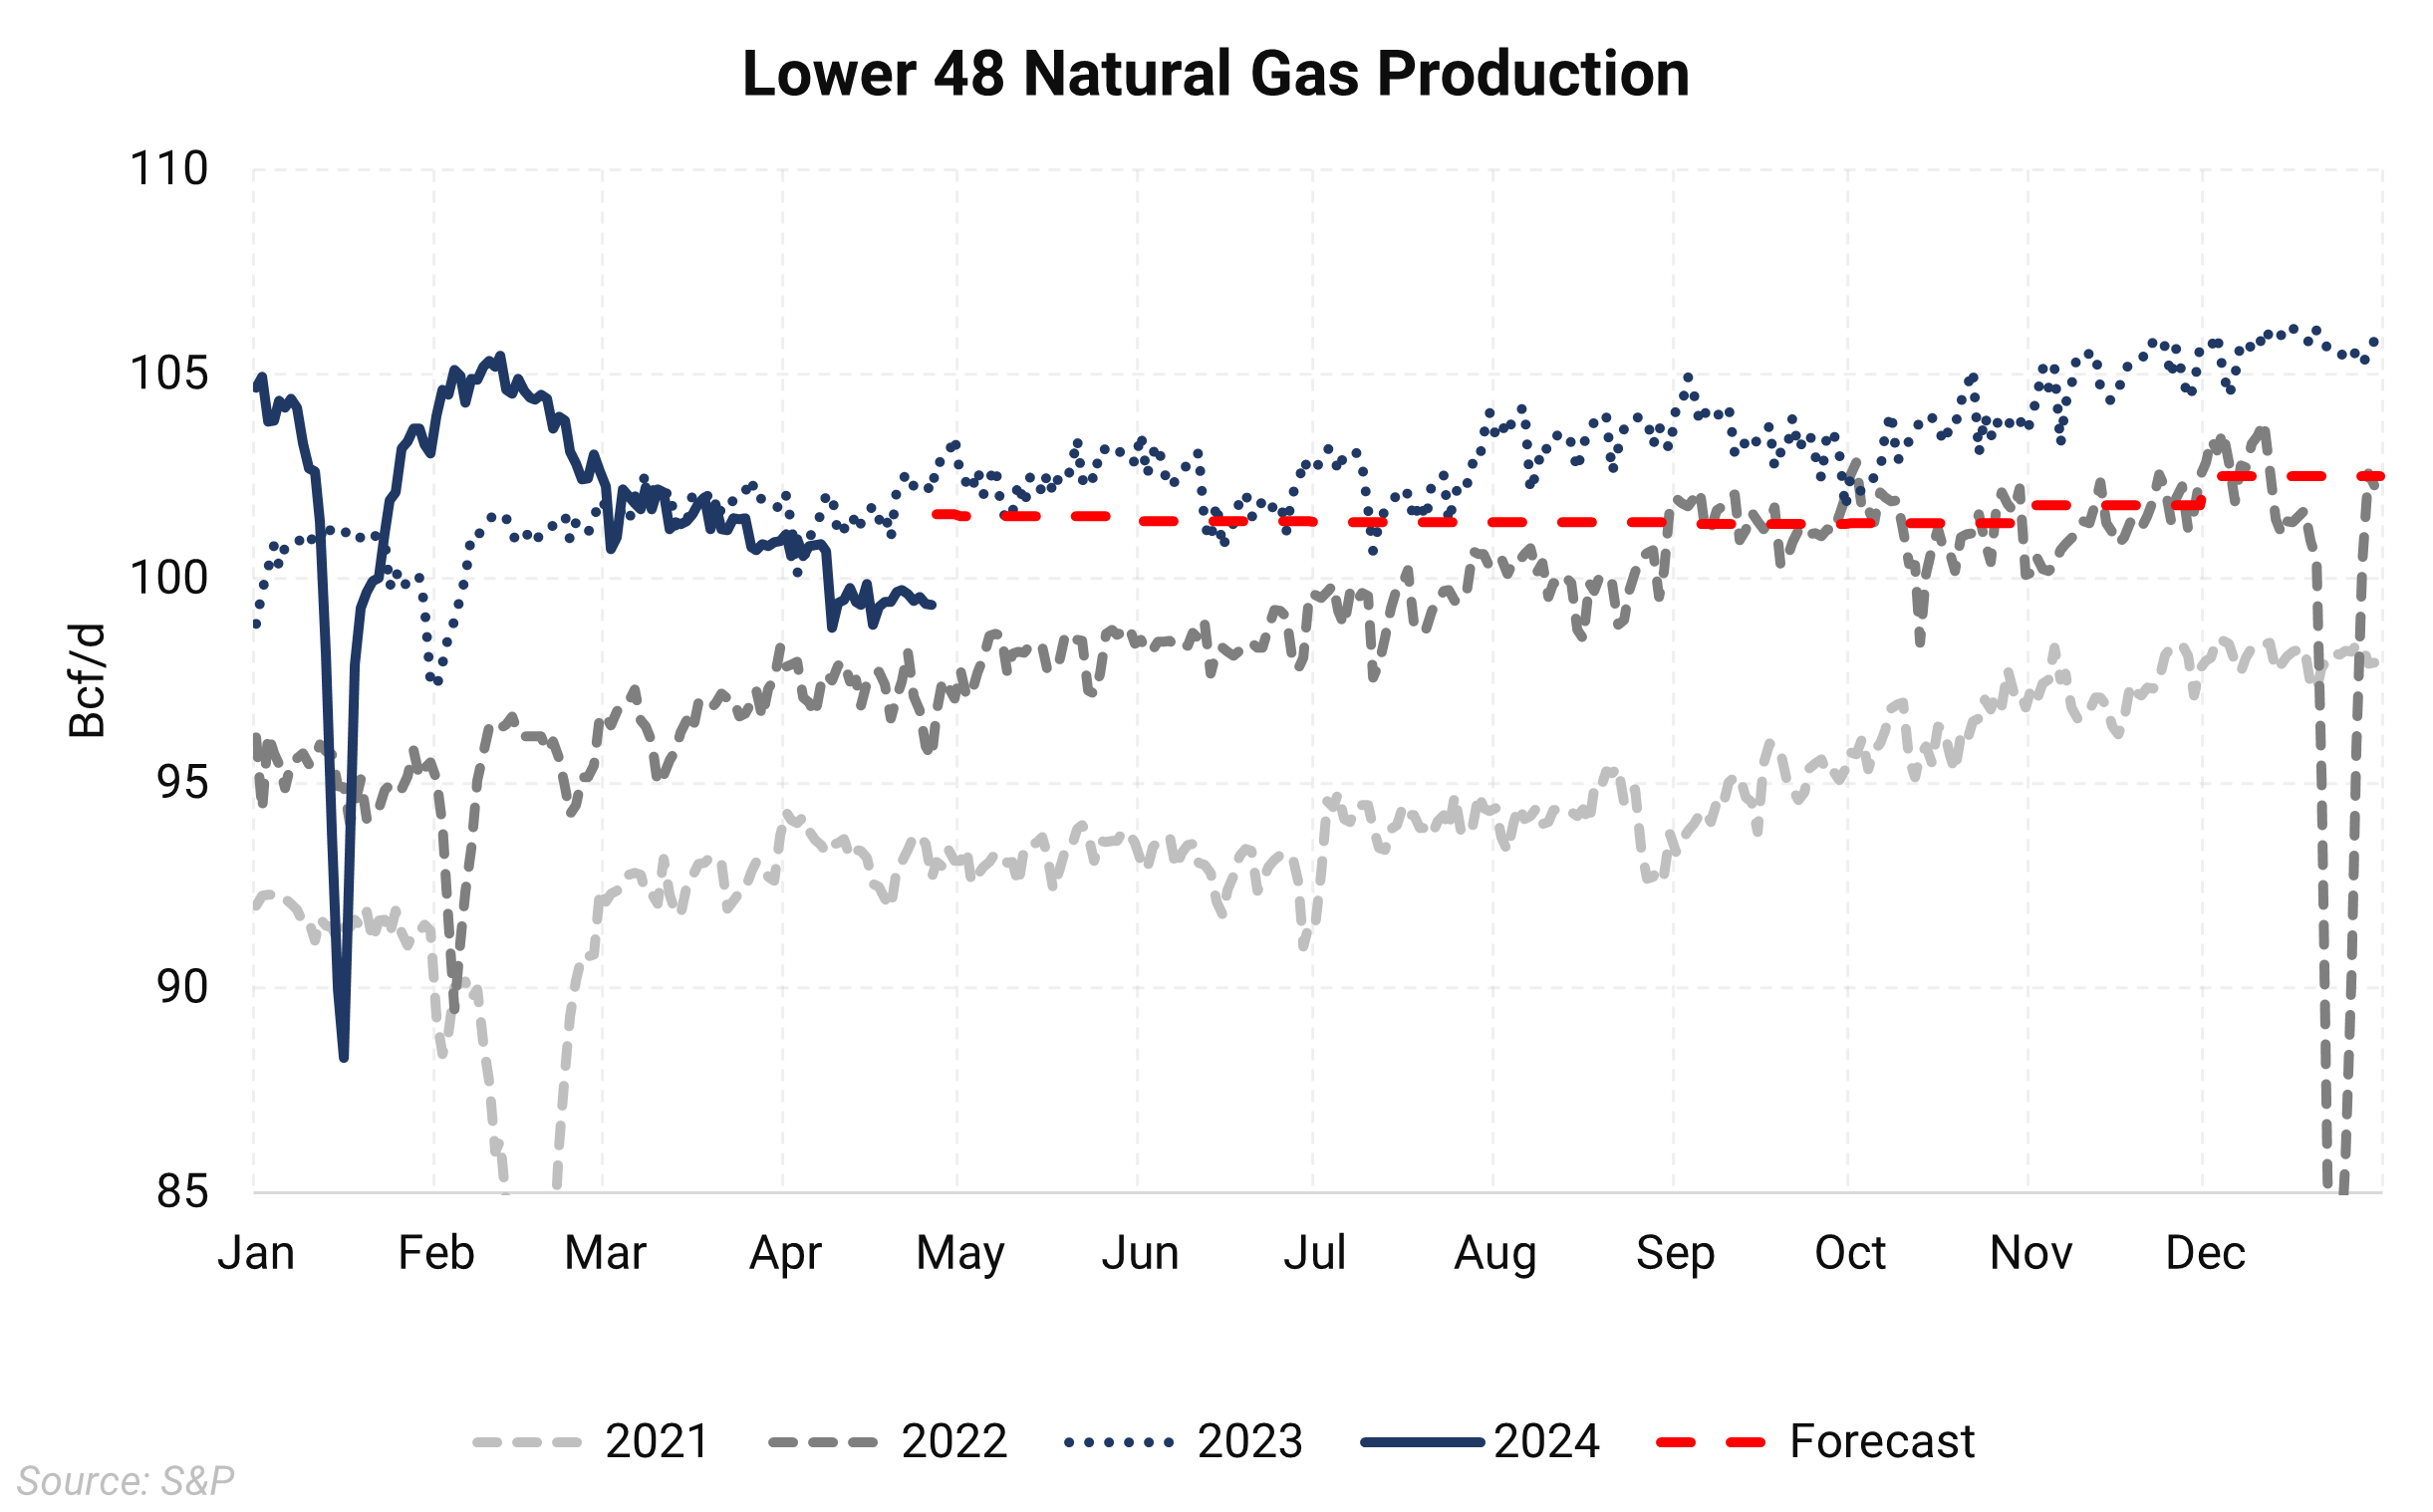
| Domestic U.S. dry gas production was hovering around 103-104 Bcf/d before the recent winter storm. Freeze-offs brought Lower-48 production to just above 90 Bcf/d. Supply should recover rather quickly to pre-storm levels as the back half of January warms considerably. | ||
|
|
||
| Above is the historical relationship between spot Henry Hub gas prices and surplus(deficit) to the 5-year average in inventories. | ||
 |
||
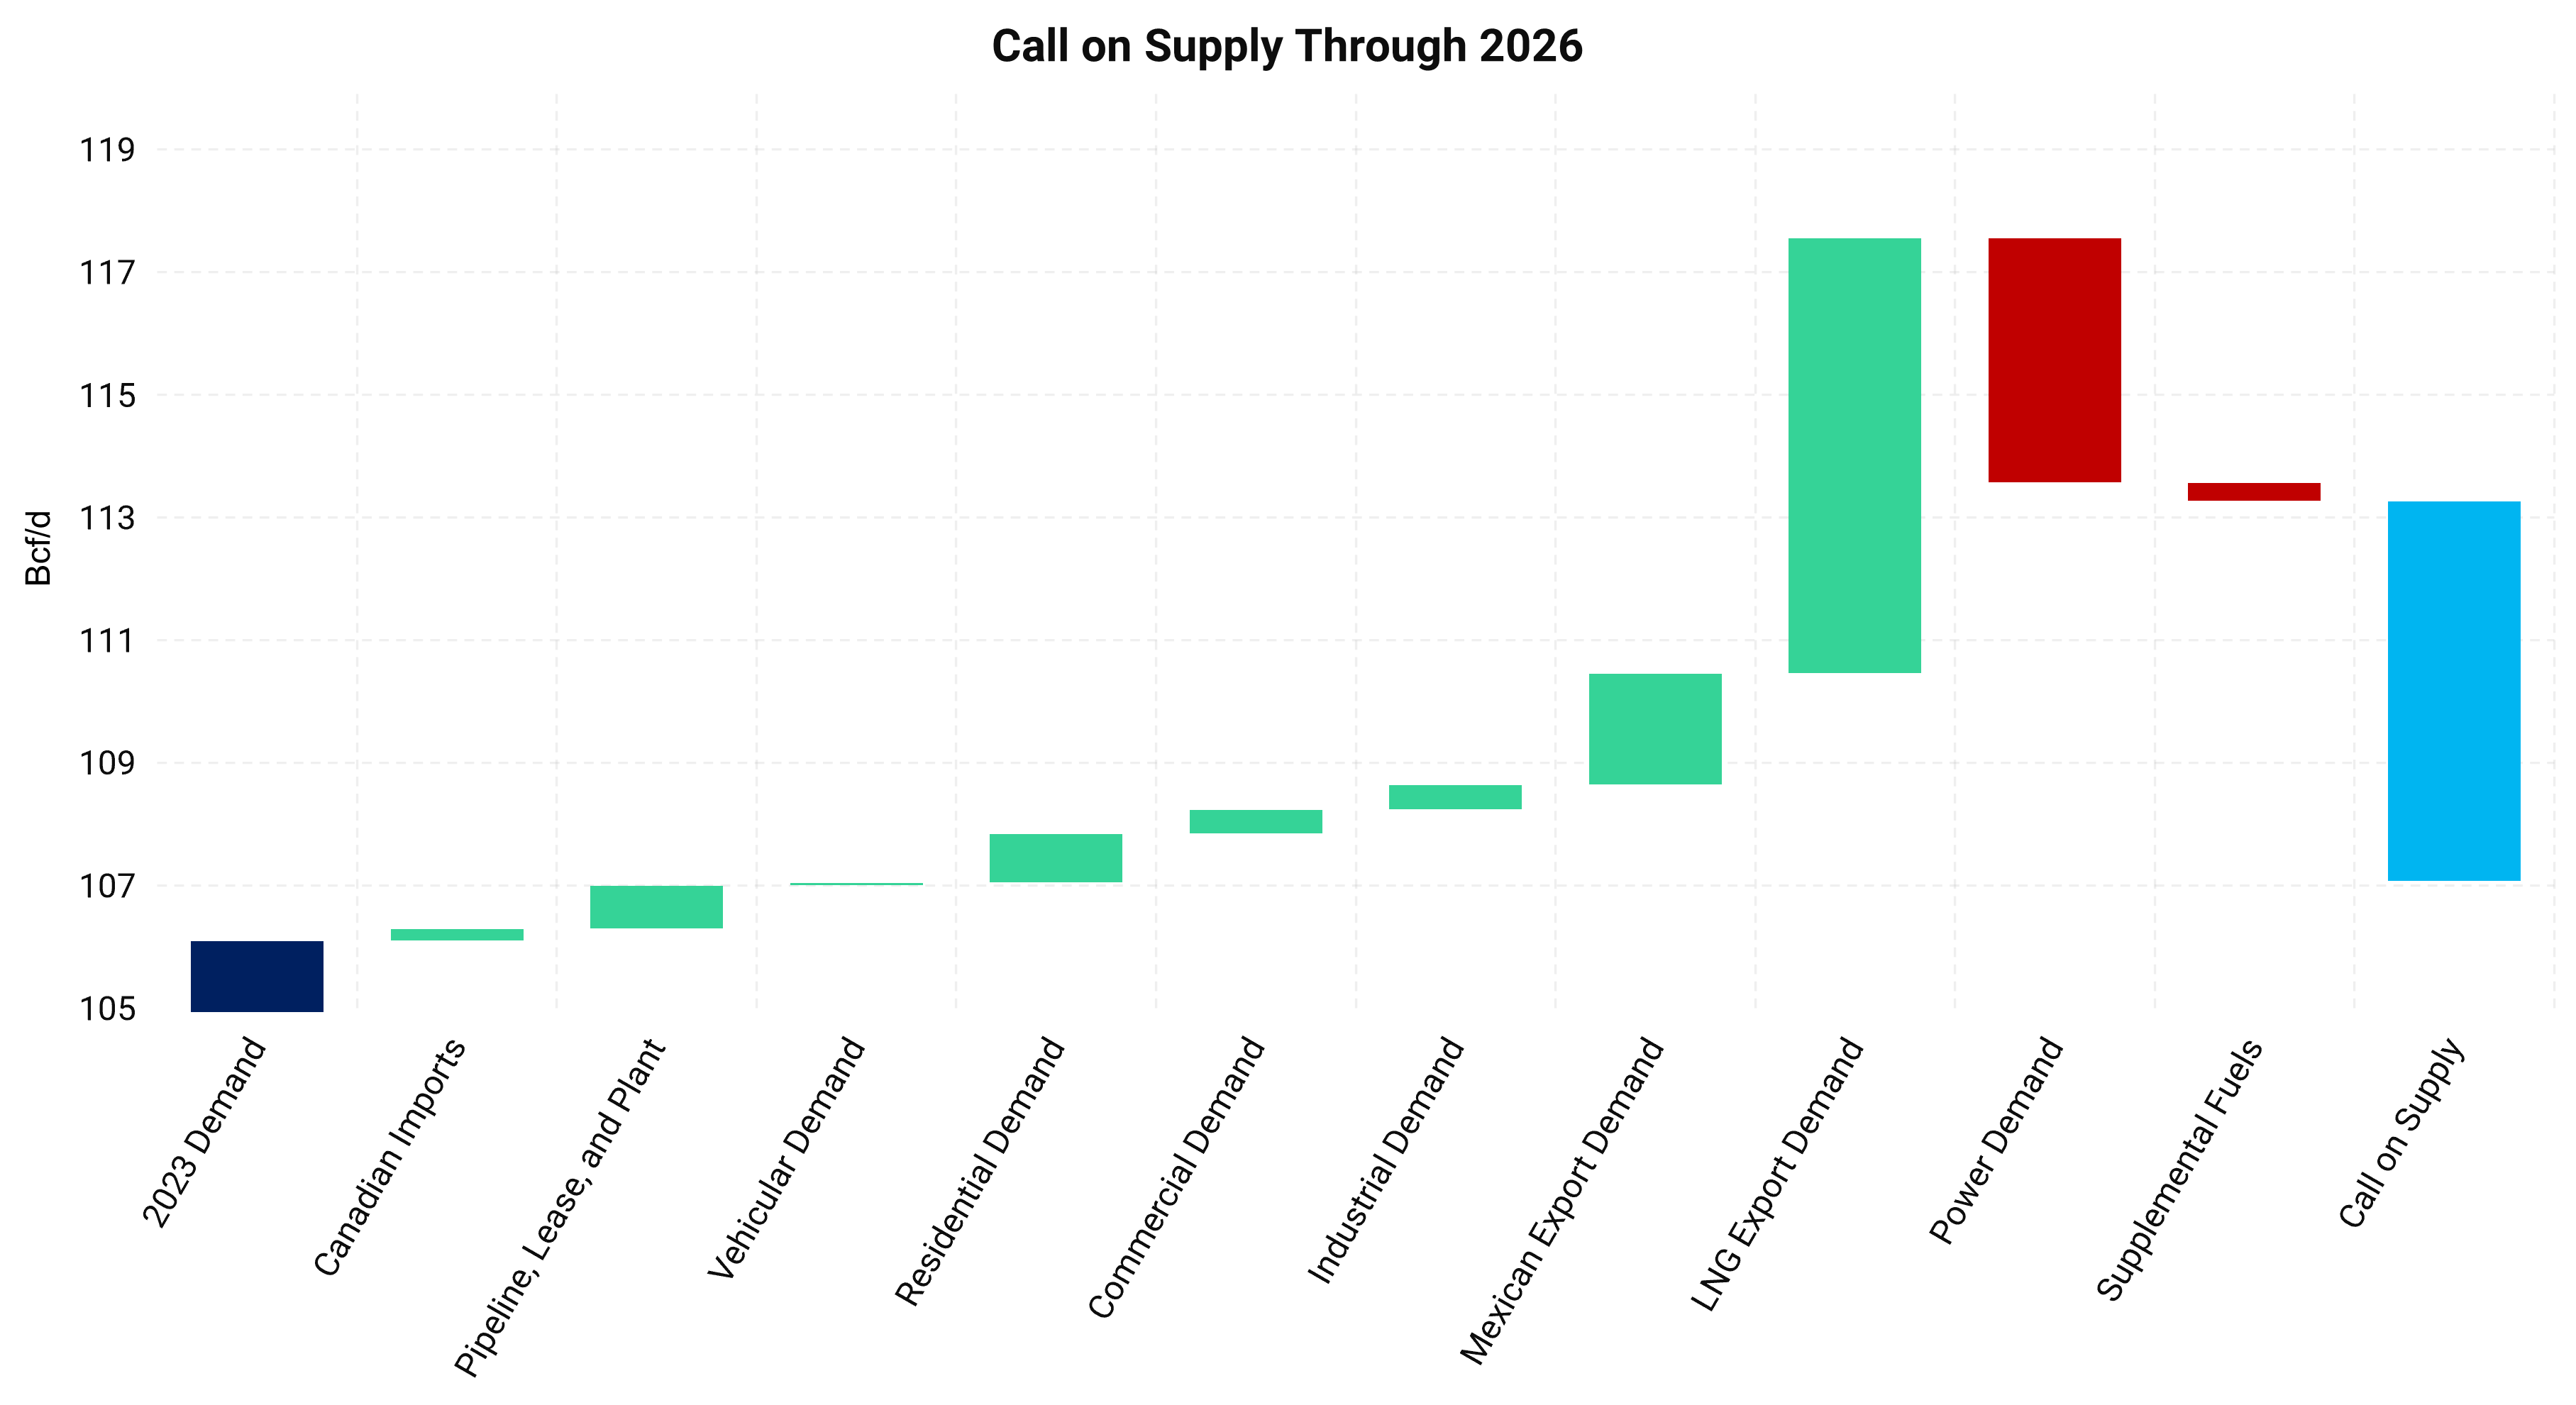
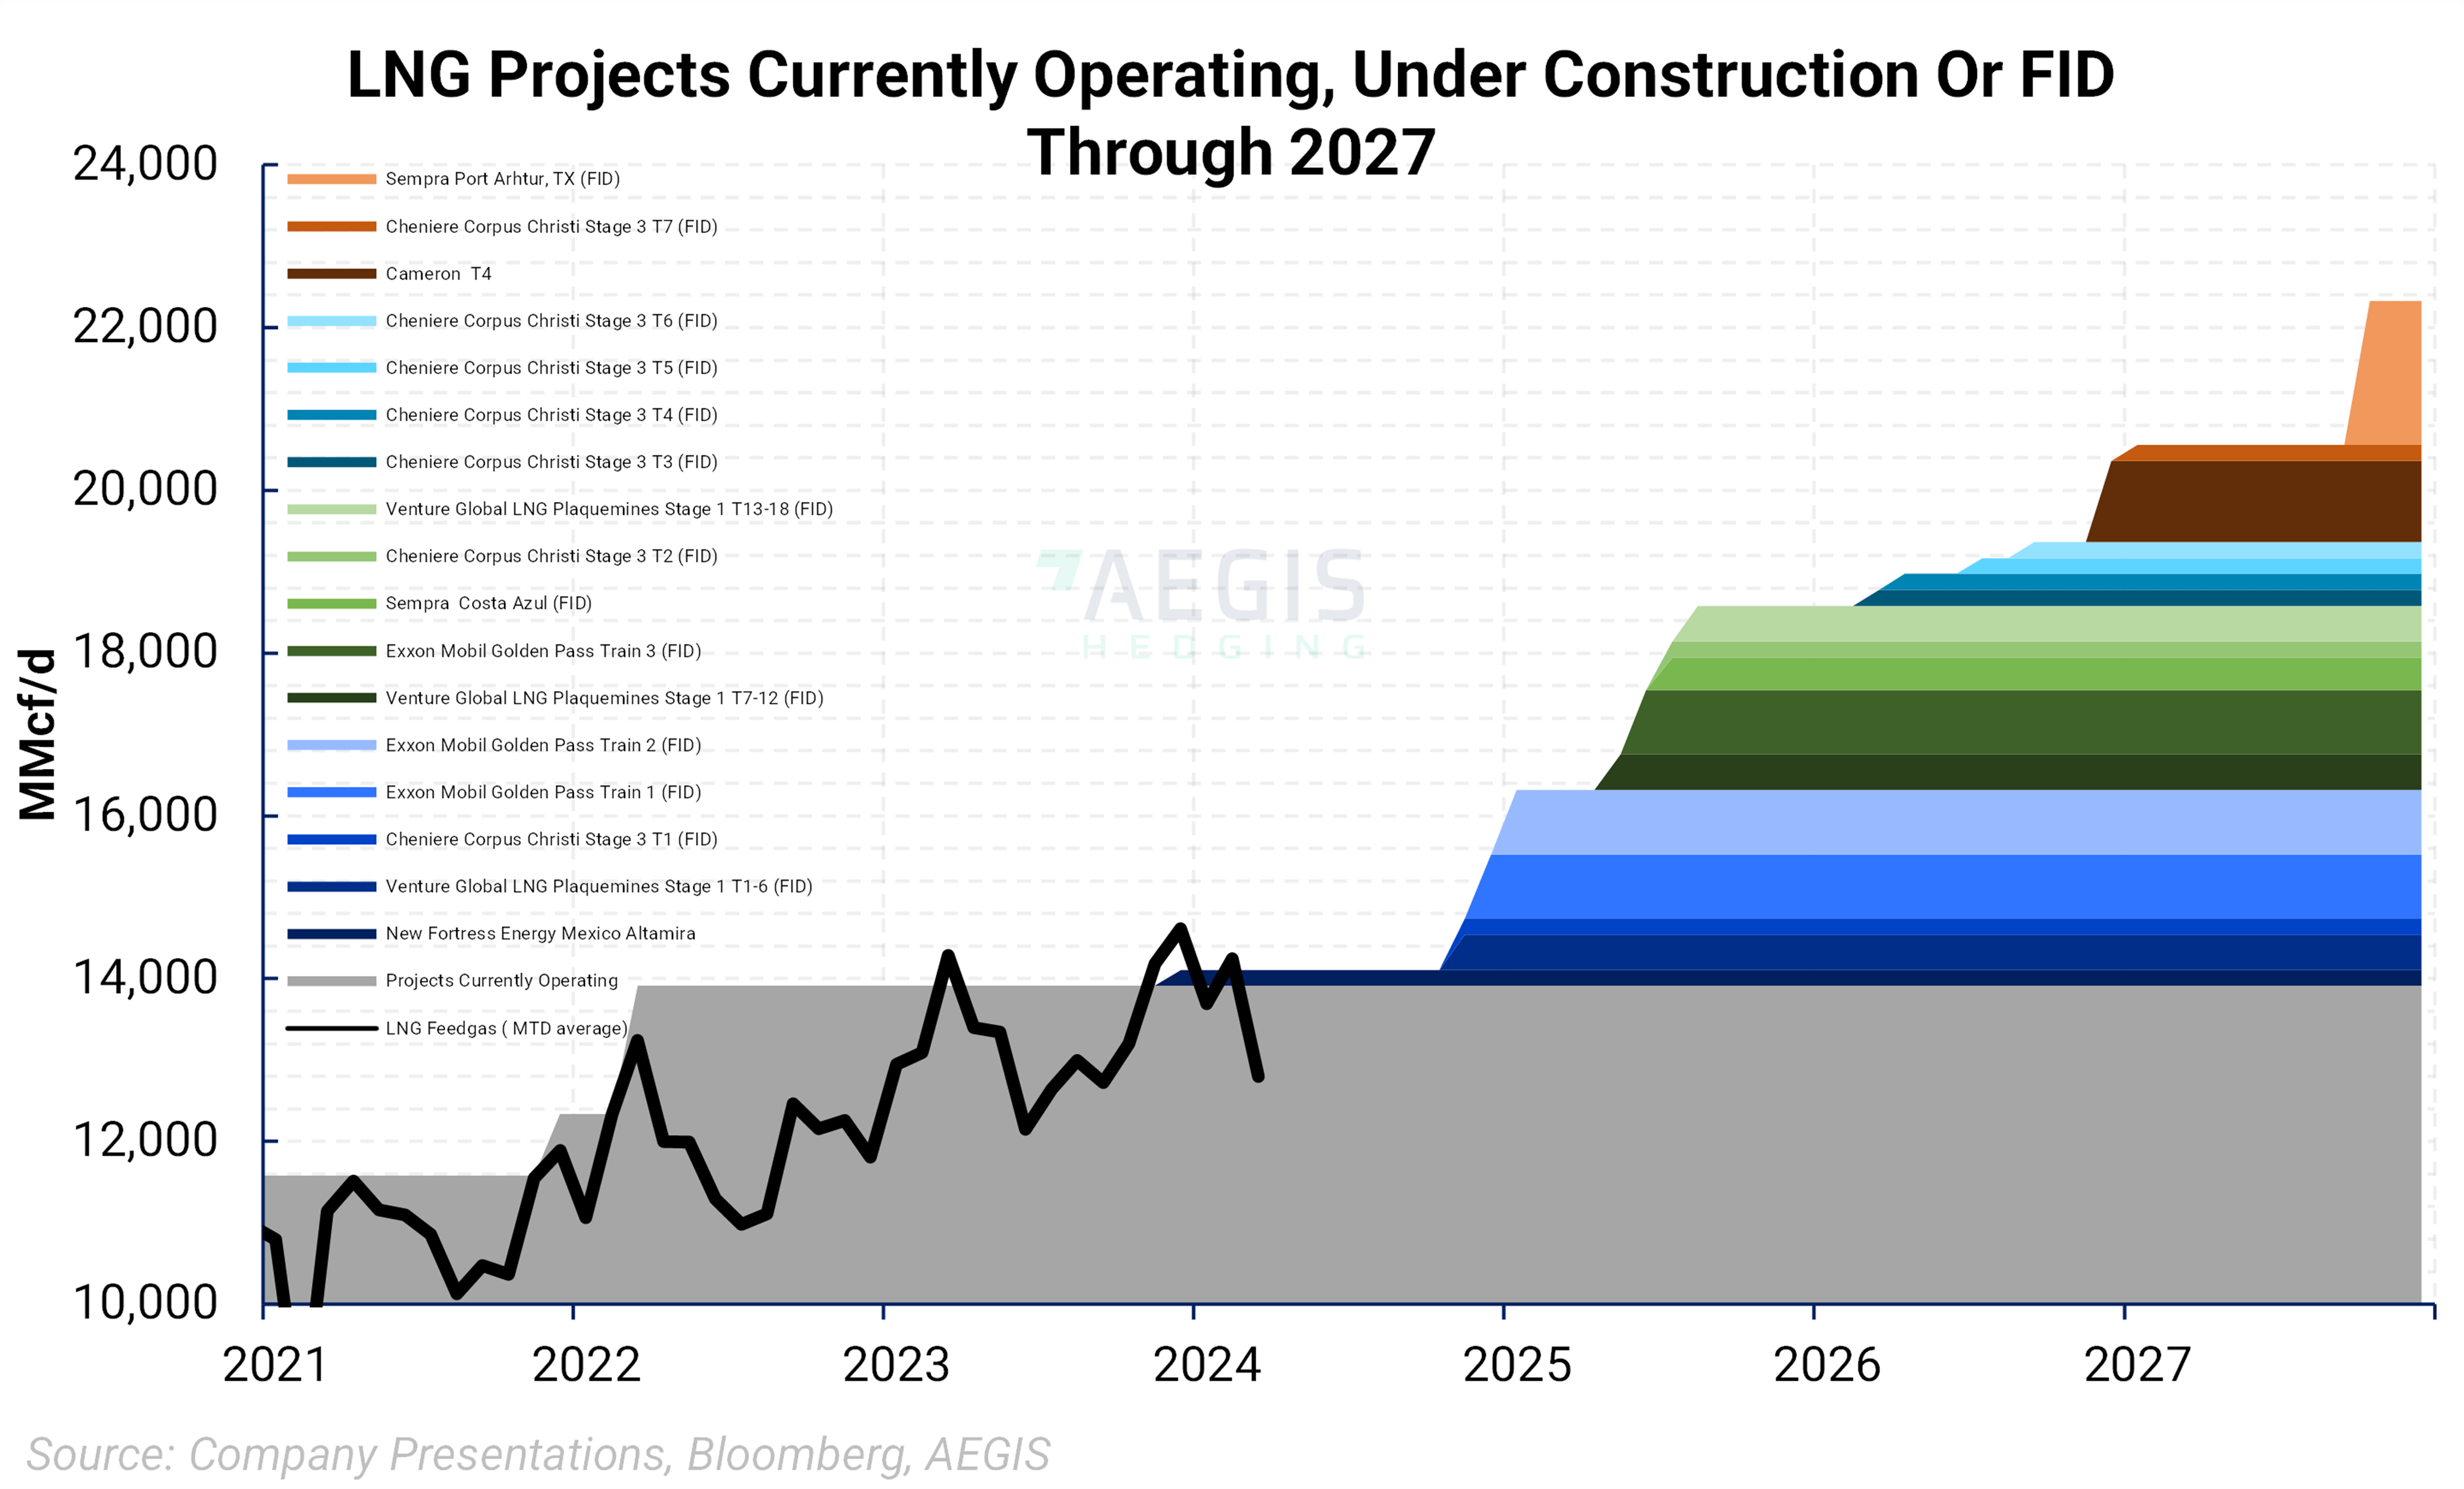
| LNG demand growth is set to be nearly flat in 2024 before ramping up in earnest in 2025 through the rest of the decade. New LNG facilities have been the engine of demand growth for gas since 2016. With material LNG volumes slated to come after 2024, this year's supply-demand balance could be weak. | ||
|
Source: S&P |
||
| There is about a 6 Bcf/d "call-on-supply" through 2026, where the U.S. will need to find enough supply to match incoming demand. The number will grow larger by 2030 as many LNG facilities are planned but have yet to take FID. The future need for supply may be a tall order for gassy shale plays as Appalachia has limited egress, and Haynesville resides in a small footprint relative to other basins. This could lead to timing mismatches between new demand and supply responses. | ||
 |
||
Crude Oil |
||
|
|
||
|
|
||
|
|
||
|
|
||
|
|
||
|
|
||
|
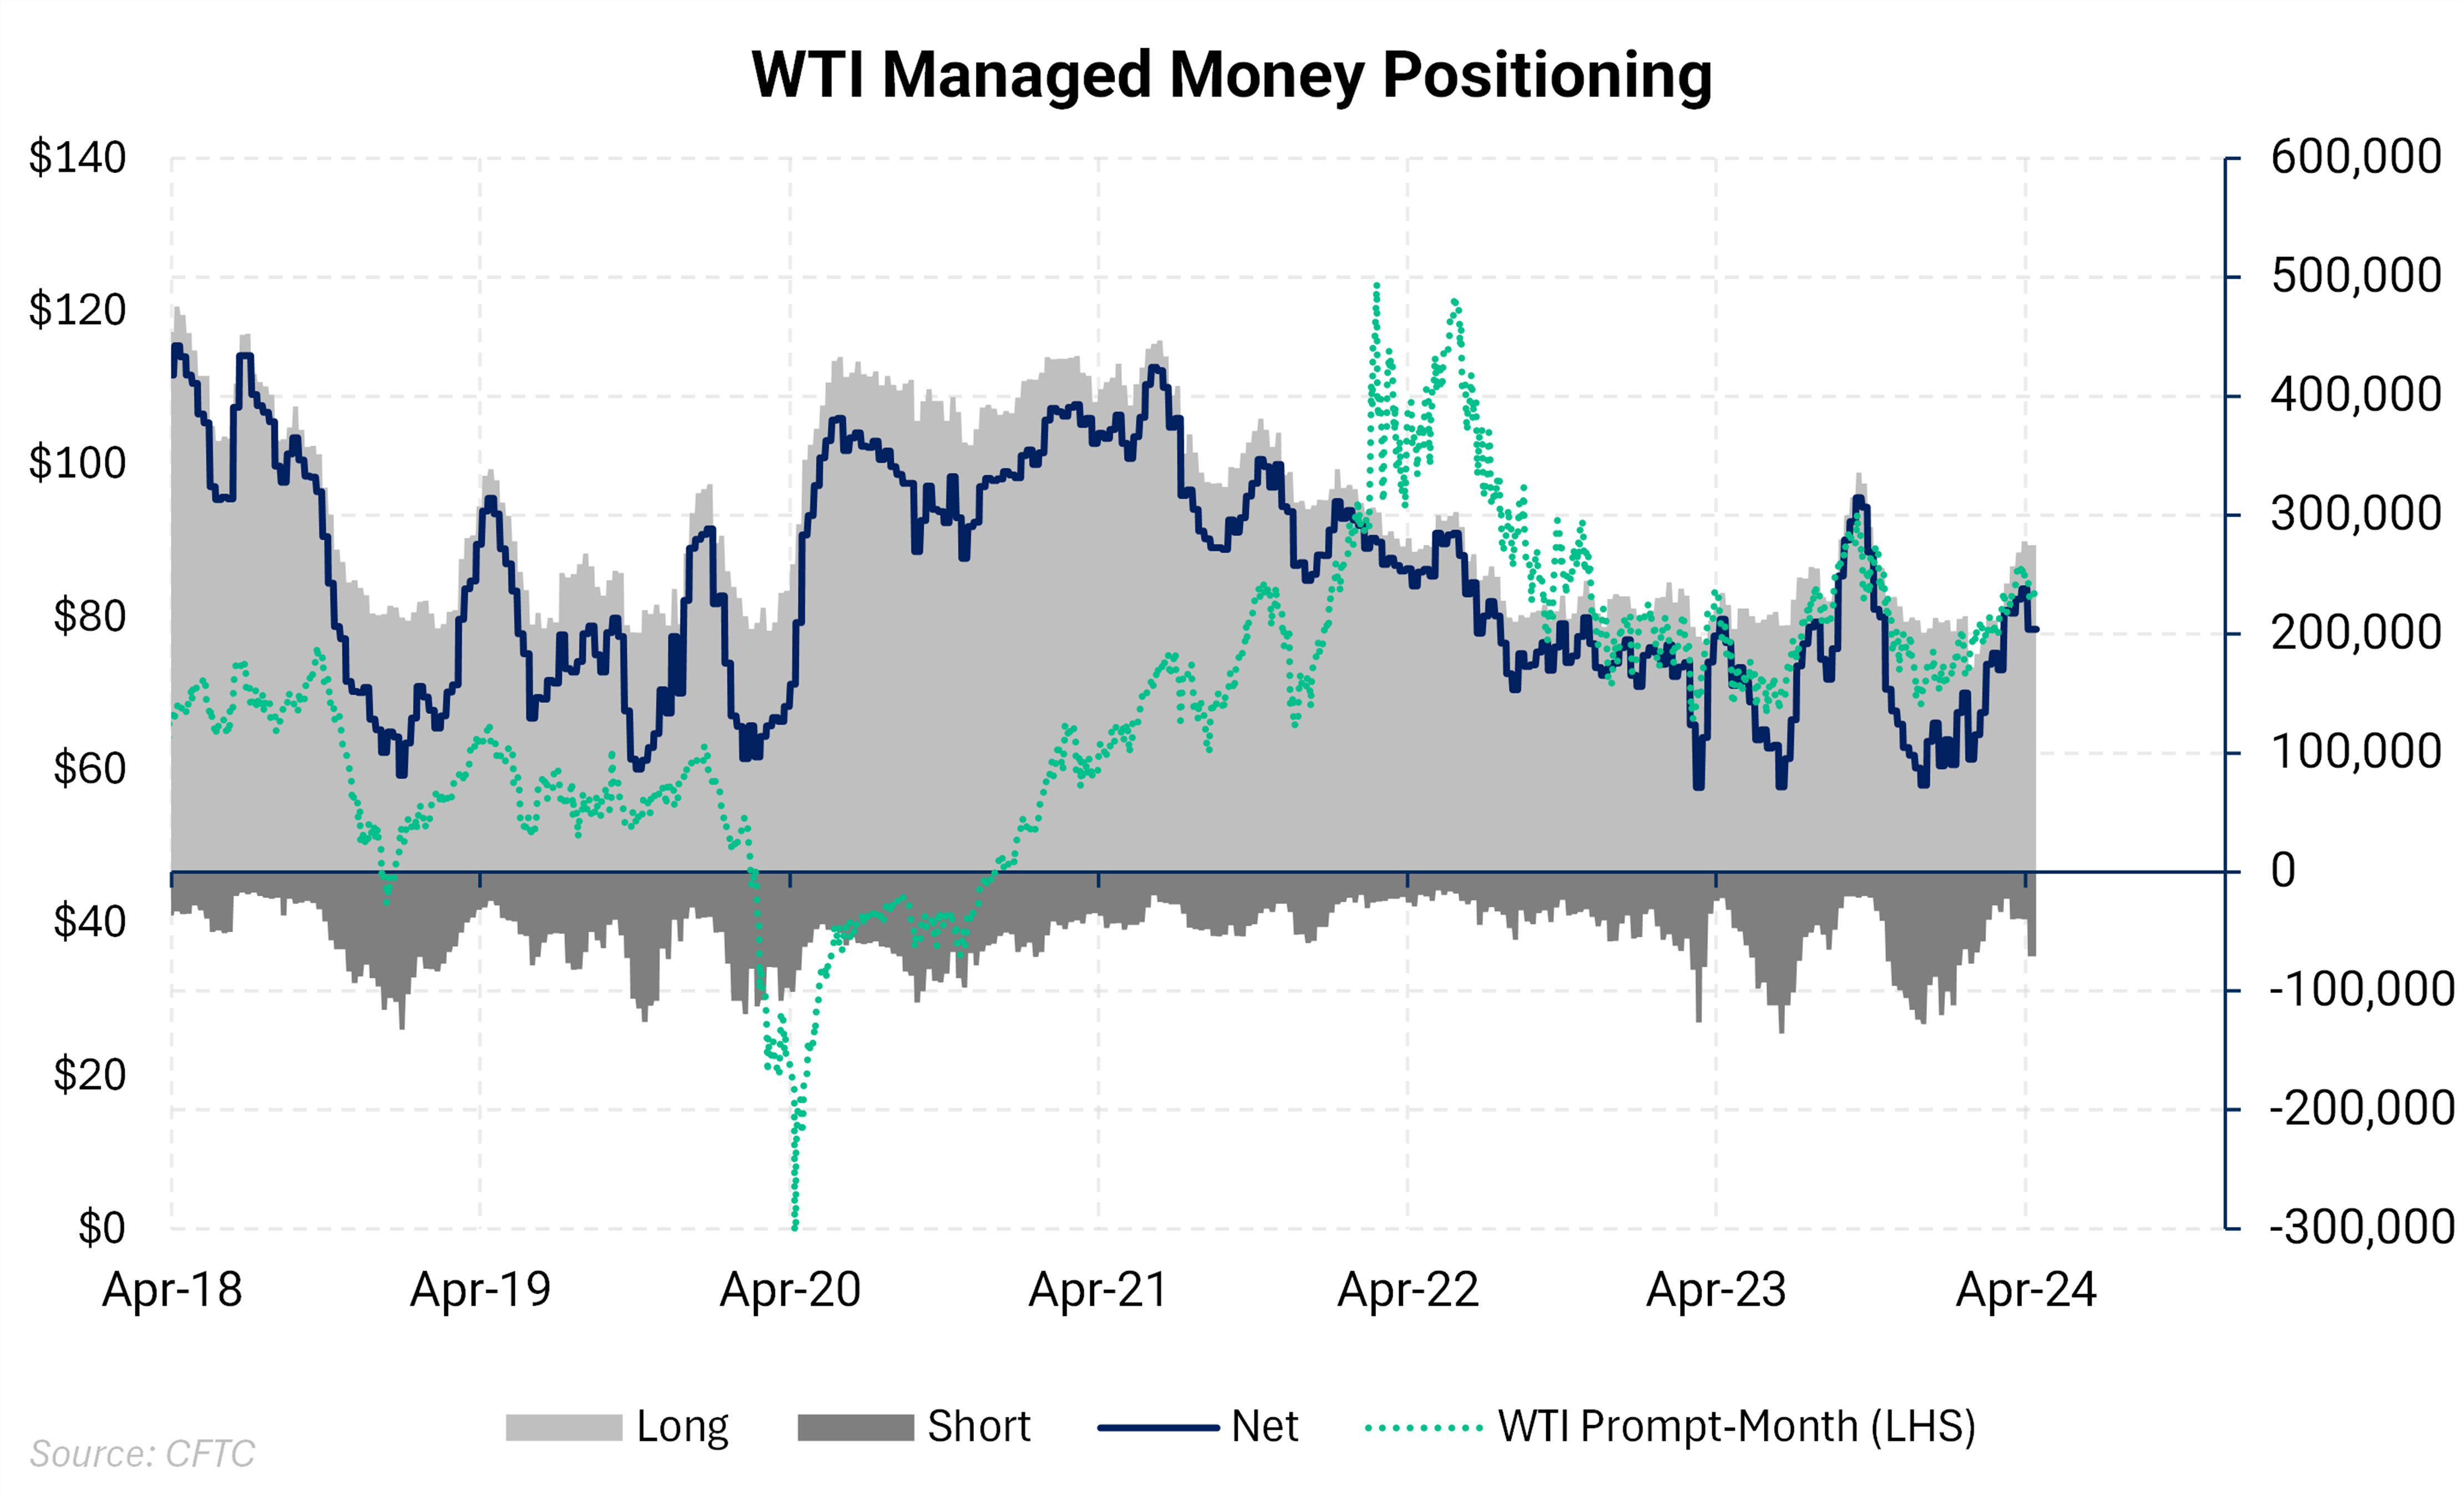
Net-length for the CFTC category Managed Money, rebounded from near historically low percentiles - following oil's rally since mid-January. Many oil market observers point blame at this "speculator" community for the veracity of the price move up, but it can be cut both ways. We view net-speculator interest as potential fuel to the fire when the crude market experiences bullish or bearish catalysts. One could argue that if the oil market gets a bullish catalyst or a shift toward positive sentiment, participants in this category have plenty of dry powder to add length. |
||
|
|
||
|
|
||
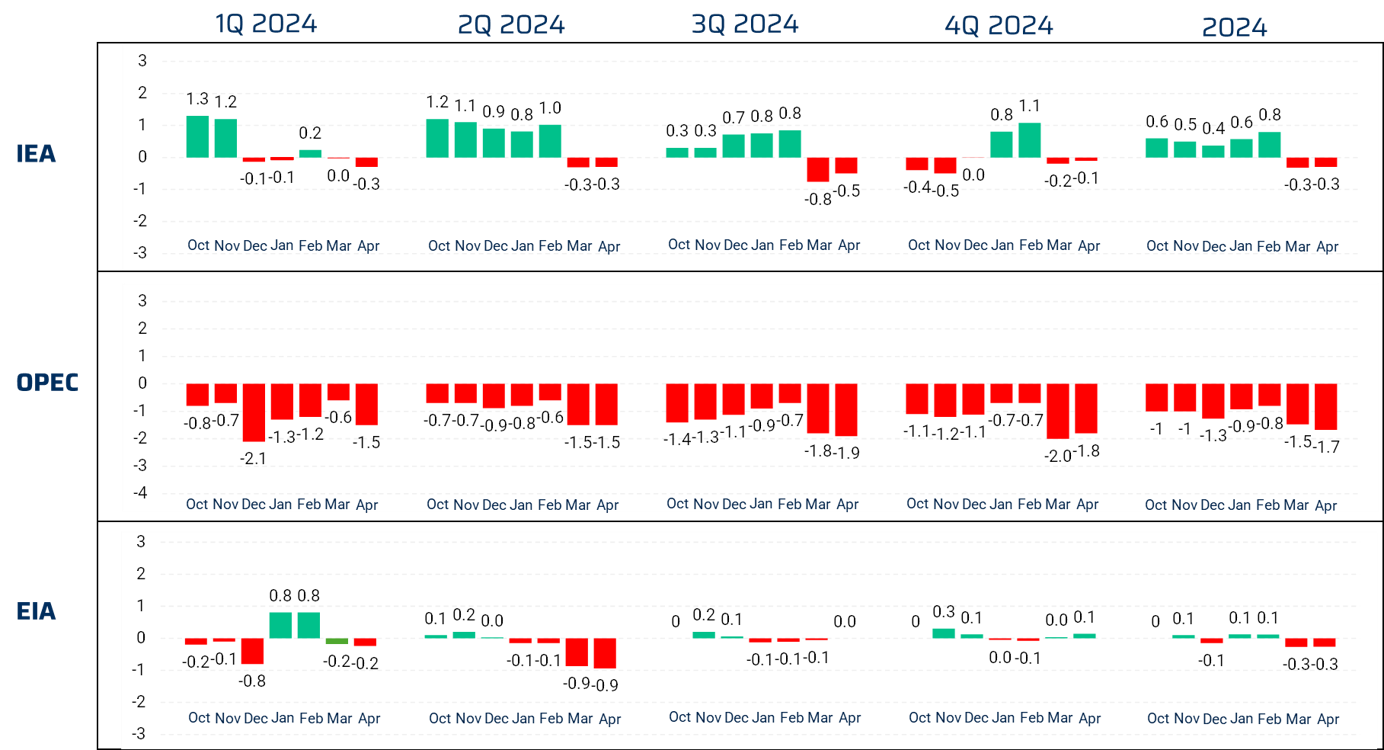
IEA, OPEC, EIA Monthly Net Supply-Demand Balance By Month |
||
|
The table above shows the three highly cited agencies that provide oil supply-demand forecasts. Notice the large disparity in the outlooks where the IEA estimates look conservative compared to OPEC's research. |
||
|
|
||
|
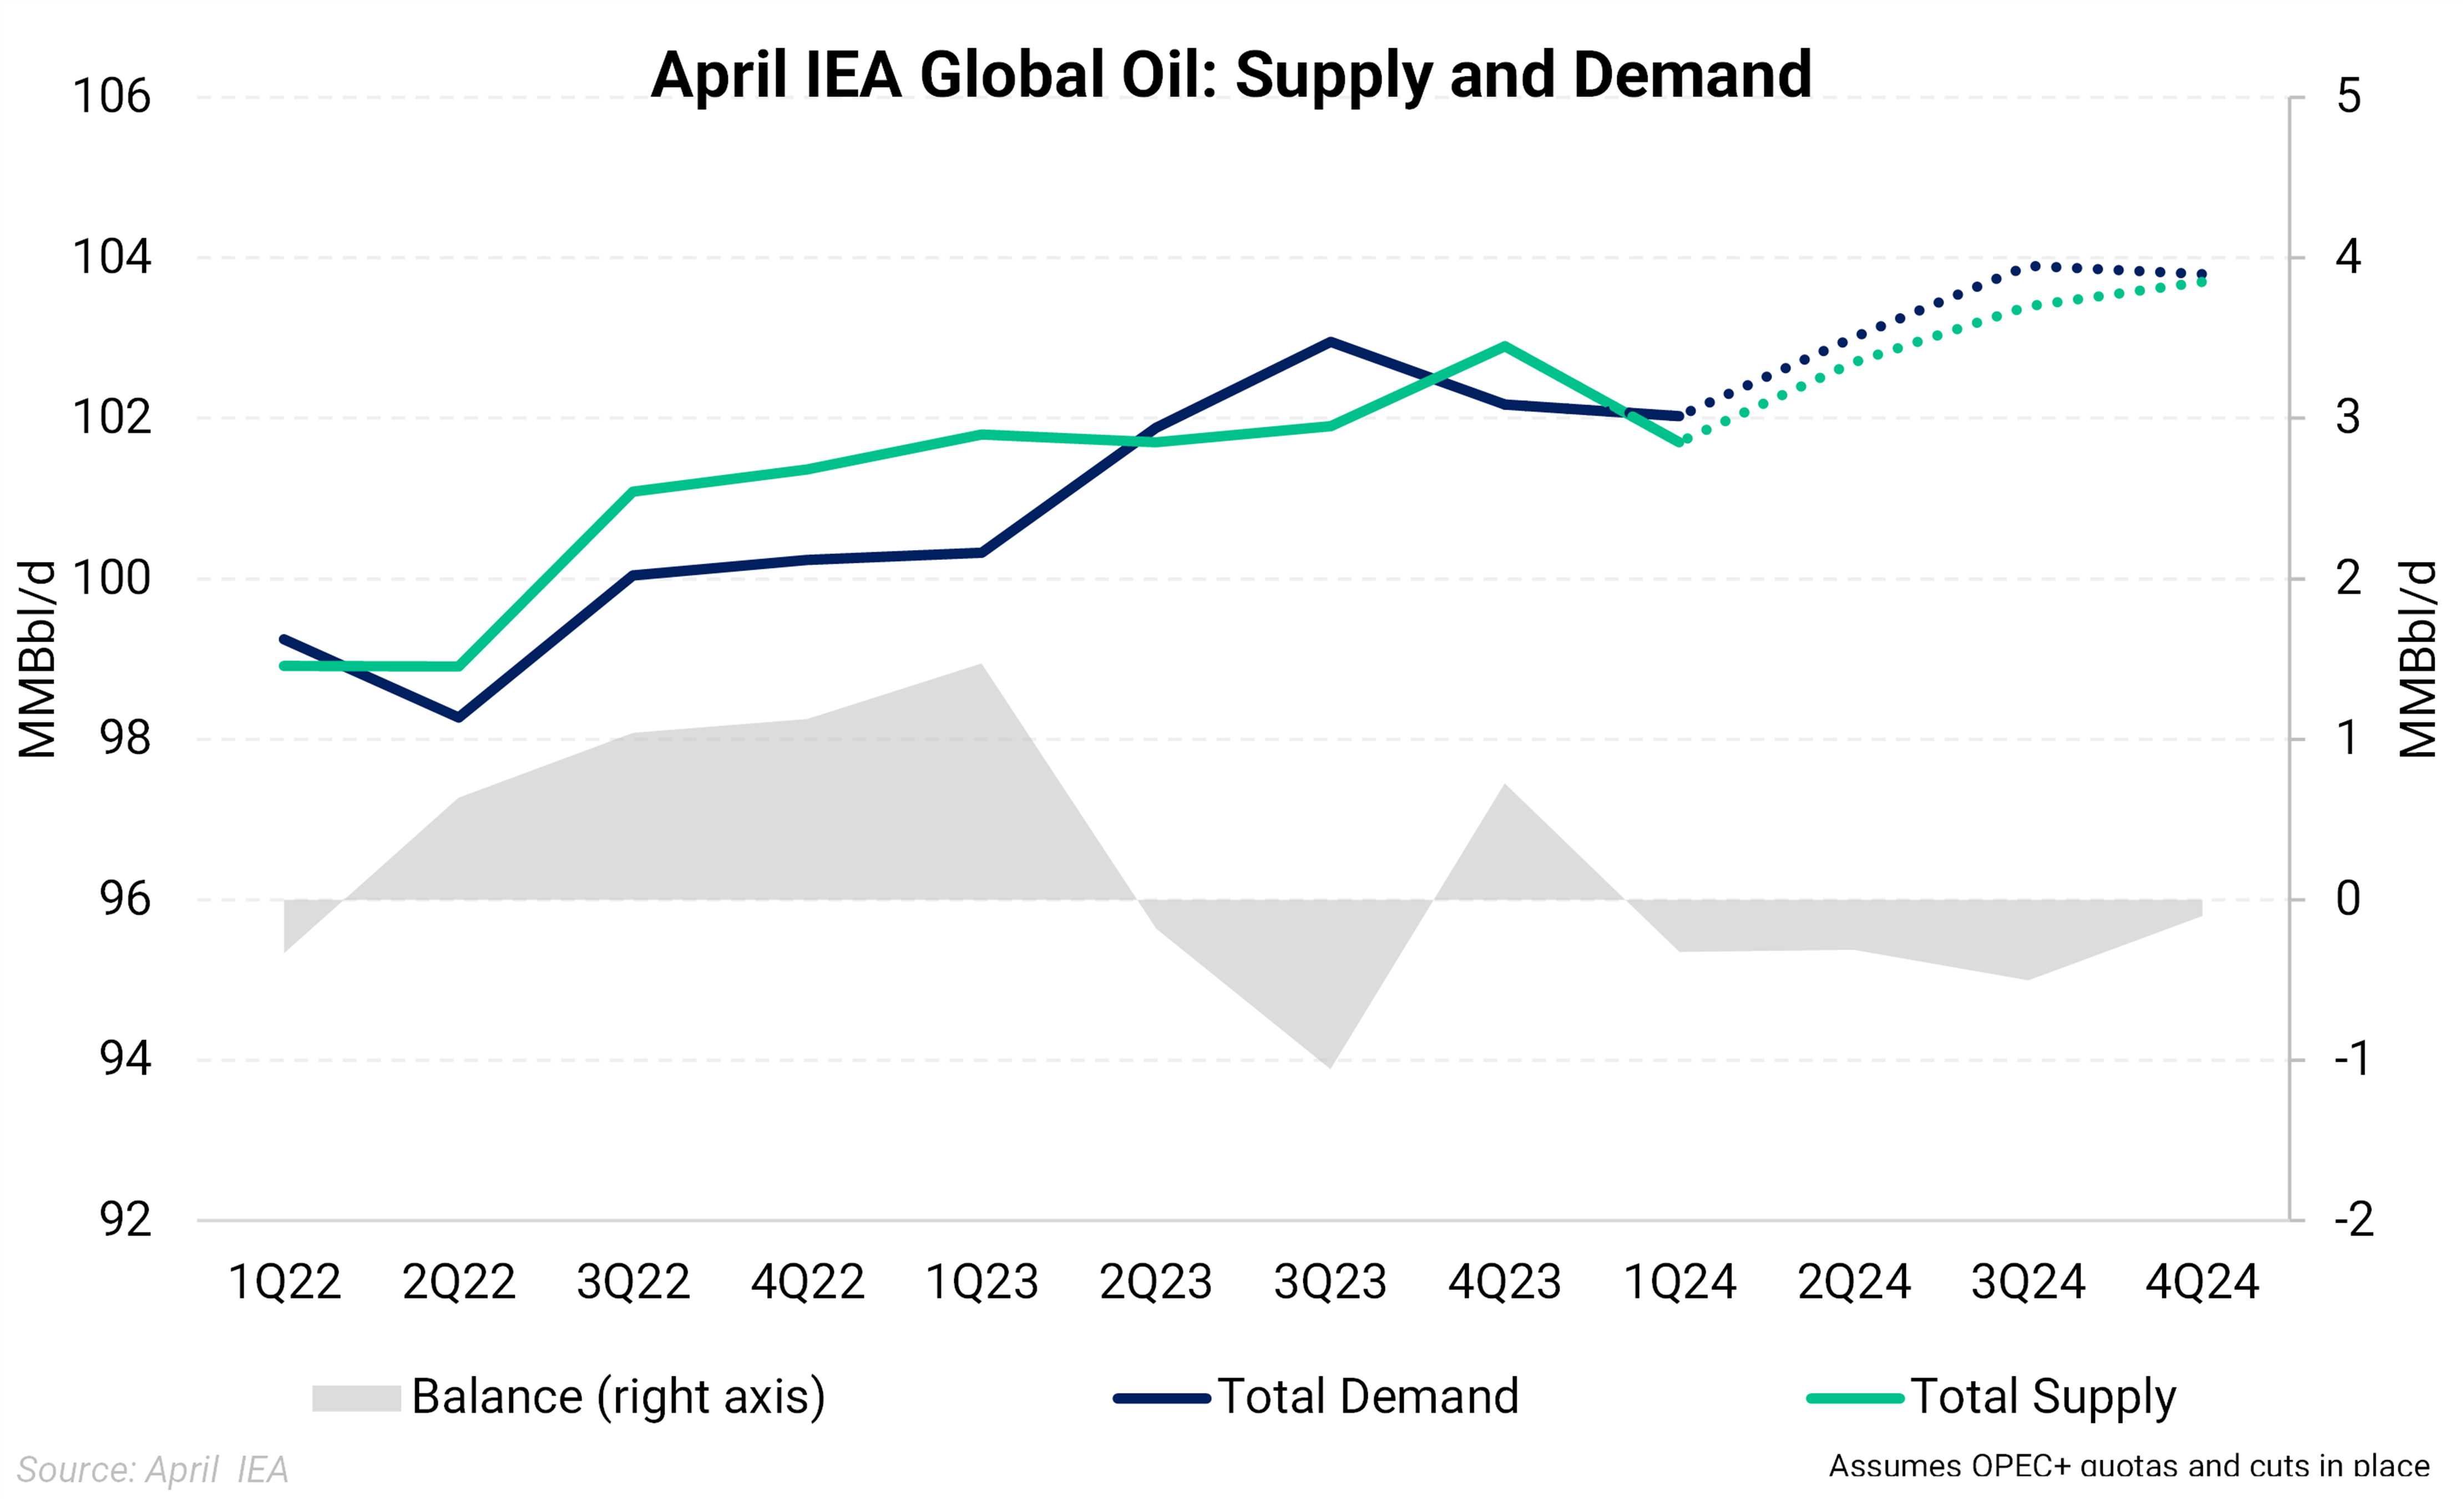
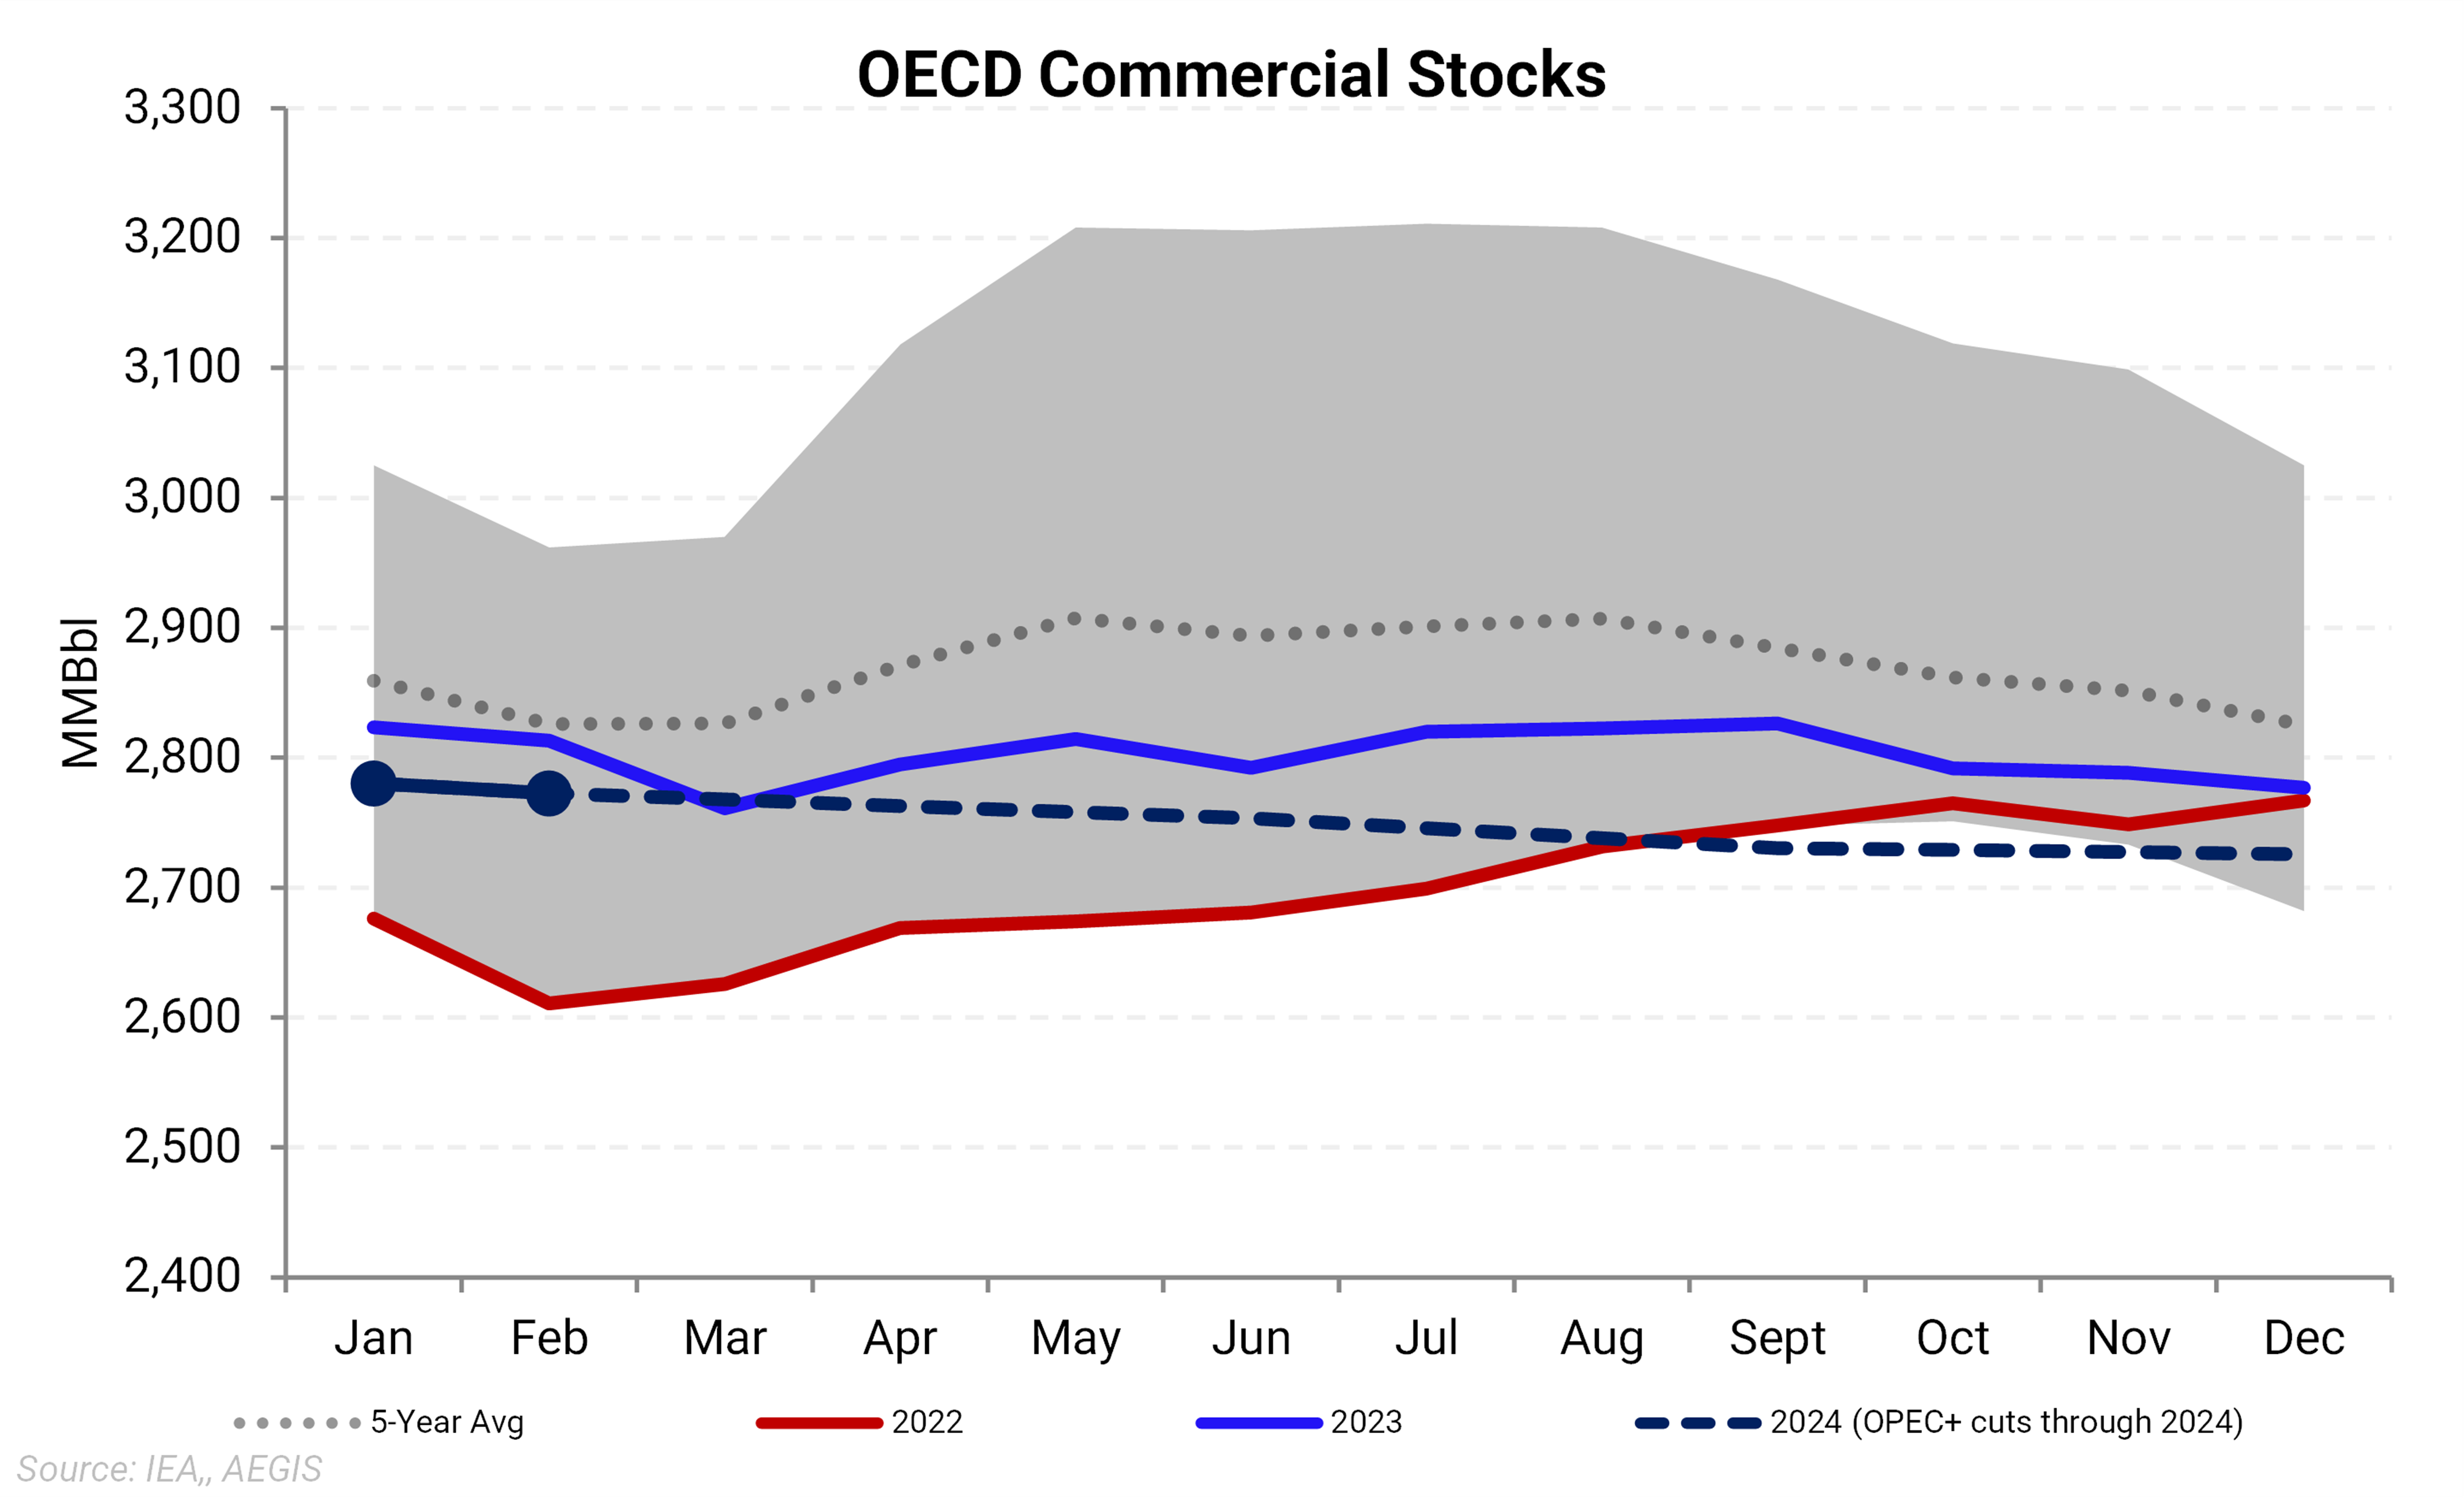
It is our belief that oil prices, over time, are highly correlated to surplus or deficits to the 5-year average of OECD commercial stocks. The above uses the latest April IEA report, the latest data point for OECD stocks in February. After applying IEA assumptions, we get the dashed blue line, which shows a slow draw in inventories throughout this year. This assumes OPEC+ extending its cuts through 2024. |
||
|
|
||
|
|
||
|
|