Natural gas usage for power generation has overperformed in June. Is this a preview of what is to come this summer?
Natural gas usage for power generation has overperformed in June. Is this a preview of what is to come this summer? Let's look at weather first. T...
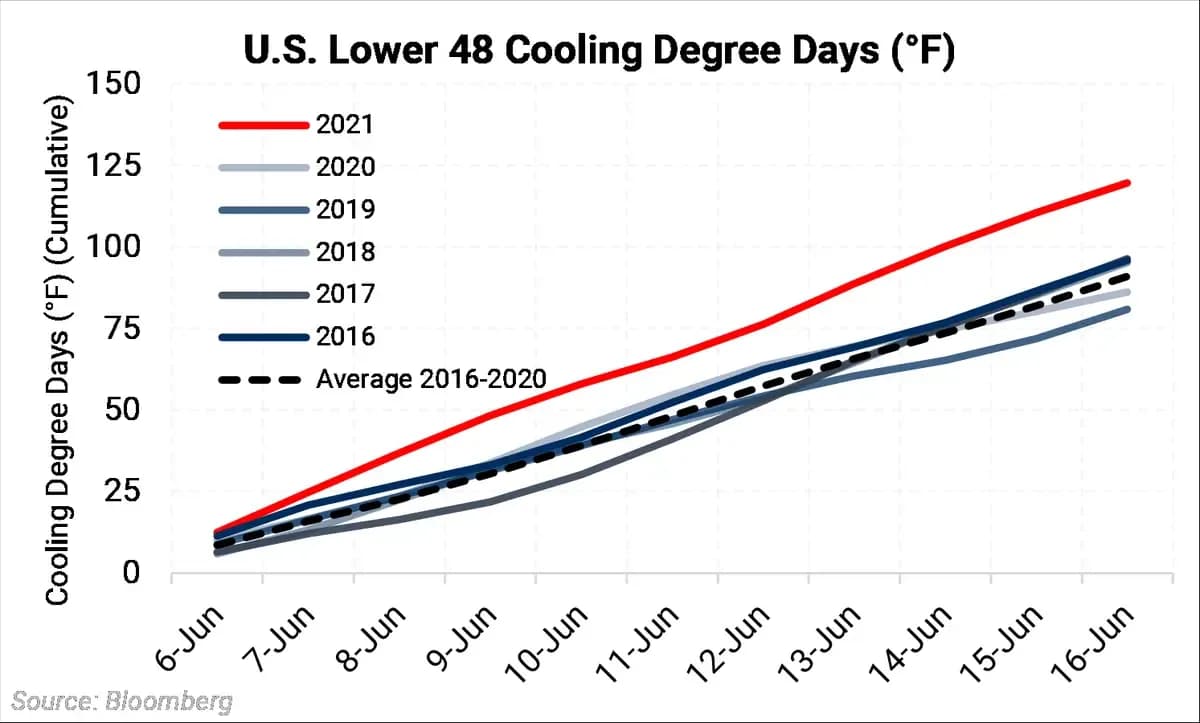
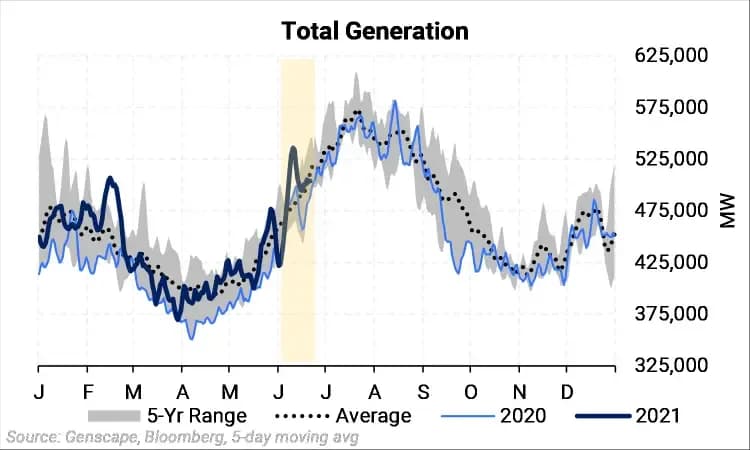
Let's look at weather first. Temperatures in the U.S. between June 6 to June 16 were much above-average. The chart below shows the cumulative cooling degree days (CDDs) for this period in June. As a refresher, a CDD is the number of degrees that a day’s average temperature is above 65 °F. By one measure, there were 120 total CDDs between June 6-16 in 2021, compared to the normal 90 over the past five years. As the chart below shows, 2021 was unseasonably hot compared to other years; therefore, the total generation for electricity was some 30 GW higher on average than the 2016-2020 average. | |
|---|---|
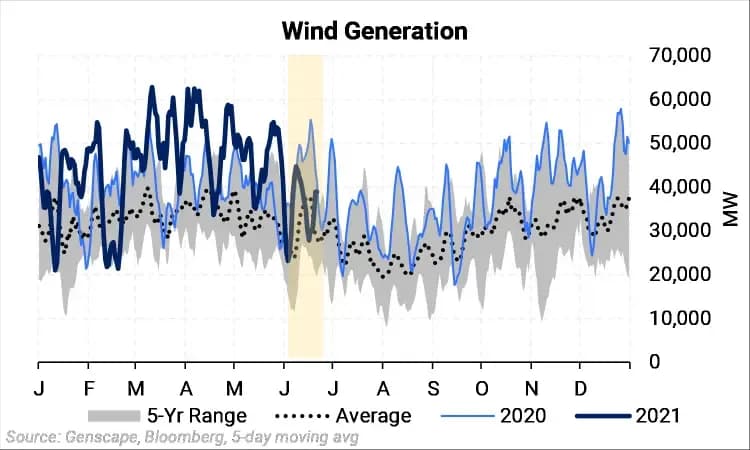
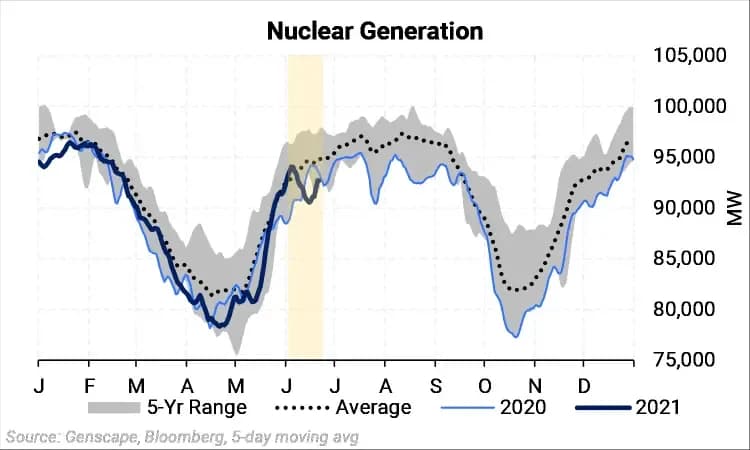
Natural gas could participate in the overall increase in total generation much more than usual due to unplanned outages throughout the power stack. Out west, hydropower generation has been far below normal due to the recent drought and below-average snowpack melt. Nuclear generation capacity was reduced in June as well. An important facility to Texas and the state’s regulator was down in north Texas at a reduction of 1.2 GW. Lastly, wind power was lower than normal during this period. Many of these elements are shown in chart form below. These unplanned outages are considered the “bottom of the stack,” or power generation that is first to be dispatched. What remains after renewables and nuclear is the so-called "thermal" load, because it is filled almost entirely by burning natural gas and coal. Gas-powered power plants were able reach record amounts of burn for the period between June 6 to June 16 due to these “bottom of the stack” outages combined with above-average temperatures. Thus, the overperformance in natural gas generation can be seen as more of an anomaly than a new development in the power stack. Looking ahead to the rest of summer, we believe natural gas demand for electricity will be on the upper end of historical norms and will overperform relative to other power sources, however, high gas prices and assumed normalization of non-thermal power sources might make it difficult for gas-fired power generation to reach record levels again this summer. Below we will run through each section of the power stack to dissect what factors allowed for a higher degree of natural gas burn. | |
Power Stack Highlights | |
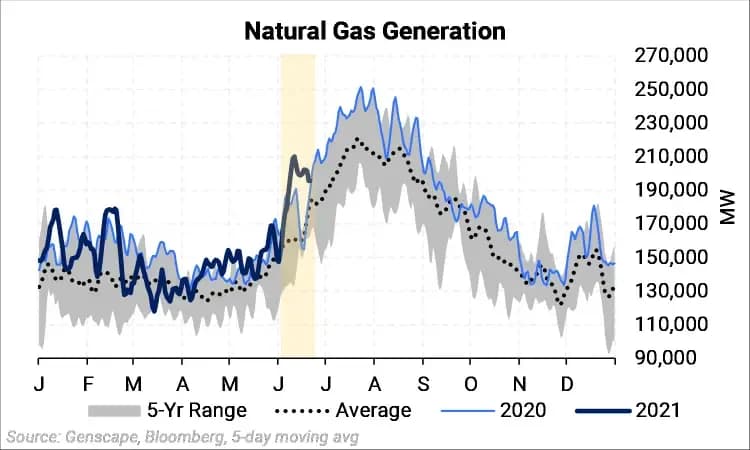
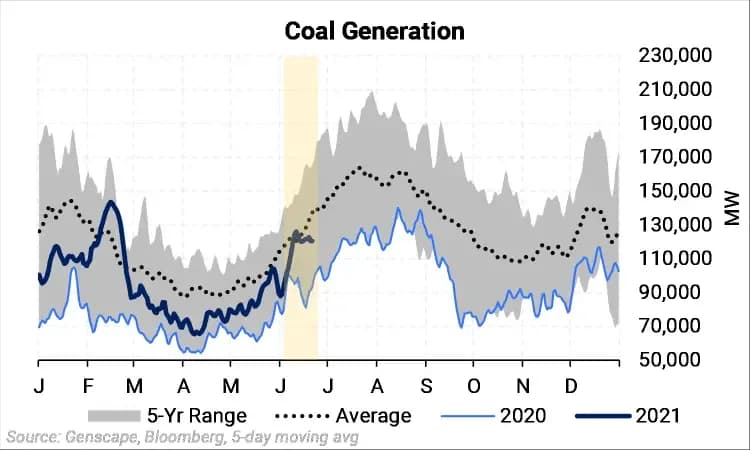
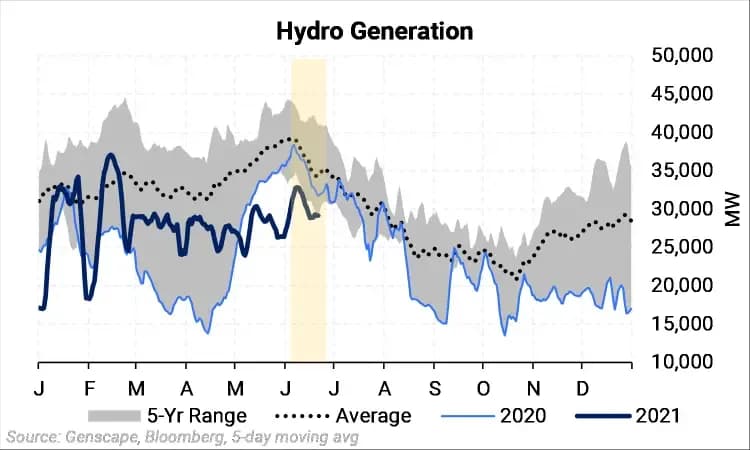
From June 6-16, total electricity generation was unseasonably high. The average amount of generation for this period is usually around 480 GW. This year, generation was over 509 GW, some 50 GW over normal for three days resulting from extreme heat in the U.S. West and Texas. The peak three days between June 6 and June 16 was when ERCOT issued conservation alerts to its customers to avoid blackouts as projected load was forecasted to exceed available capacity. Natural Gas was able to benefit significantly from the overall rise in power demand. The early summer heat resulted in an average of 200 GW of power produced by gas turbines versus 159 GW for what is normal for June 6-16. In addition, gas could participate to a greater degree than normal with the rise of overall generation due to problems in other parts of the power stack. Coal-fired power plants were able to participate to some extent but less so than gas. A drought in the West and below-average snowpack exiting spring has greatly handicapped hydro generation for power. As a result, about 6 GW of power demand was leftover for other parts of the power stack due to below-average Hydro generation. If gas compensated for all of the lost hydropower capacity, it would translate to about 1 Bcf/d of demand. Lower wind generation between June 6-16 also supported gas-fired power generation. Power generation from wind accounted for an average of 38 GW, about 7 GW less than what was observed in 2020. It's important to note that large amounts of baseload wind capacity added over the years; therefore, 2021 is compared to 2020 here instead of the five-year average. There is currently about 120 GW of installed wind capacity, where the five-year average of installed capacity is closer to 90 GW. Nukes were down around 5 GW for the same time period due to four major nationwide outages. Texas was particularly hit hard amid hot weather as one of the state's two nuclear plants was reduced by about 50% or 1.2 GW. Solar was down around 1 GW for the highlighted period, but as the chart shows, solar accounts for a small piece of the overall power stack. Commodity Interest Trading involves risk and, therefore, is not appropriate for all persons; failure to manage commercial risk by engaging in some form of hedging also involves risk. Past performance is not necessarily indicative of future results. There is no guarantee that hedge program objectives will be achieved. Certain information contained in this research may constitute forward-looking terminology, such as "edge," "advantage," 'opportunity," "believe," or other variations thereon or comparable terminology. Such statements and opinions are not guarantees of future performance or activities. Neither this trading advisor nor any of its trading principals offer a trading program to clients, nor do they propose guiding or directing a commodity interest account for any client based on any such trading program. | |
From June 6-16, total electricity generation was unseasonably high. The average amount of generation for this period is usually around 480 GW. This year, generation was over 509 GW, some 50 GW over normal for three days resulting from extreme heat in the U.S. West and Texas. The peak three days between June 6 and June 16 was when ERCOT issued conservation alerts to its customers to avoid blackouts as projected load was forecasted to exceed available capacity. |
From June 6-16, total electricity generation was unseasonably high. The average amount of generation for this period is usually around 480 GW. This year, generation was over 509 GW, some 50 GW over normal for three days resulting from extreme heat in the U.S. West and Texas. The peak three days between June 6 and June 16 was when ERCOT issued conservation alerts to its customers to avoid blackouts as projected load was forecasted to exceed available capacity. | |
|---|---|
Natural Gas was able to benefit significantly from the overall rise in power demand. The early summer heat resulted in an average of 200 GW of power produced by gas turbines versus 159 GW for what is normal for June 6-16. In addition, gas could participate to a greater degree than normal with the rise of overall generation due to problems in other parts of the power stack. | |
Coal-fired power plants were able to participate to some extent but less so than gas. | |
A drought in the West and below-average snowpack exiting spring has greatly handicapped hydro generation for power. As a result, about 6 GW of power demand was leftover for other parts of the power stack due to below-average Hydro generation. If gas compensated for all of the lost hydropower capacity, it would translate to about 1 Bcf/d of demand. | |
Lower wind generation between June 6-16 also supported gas-fired power generation. Power generation from wind accounted for an average of 38 GW, about 7 GW less than what was observed in 2020. It's important to note that large amounts of baseload wind capacity added over the years; therefore, 2021 is compared to 2020 here instead of the five-year average. There is currently about 120 GW of installed wind capacity, where the five-year average of installed capacity is closer to 90 GW. | |
Nukes were down around 5 GW for the same time period due to four major nationwide outages. Texas was particularly hit hard amid hot weather as one of the state's two nuclear plants was reduced by about 50% or 1.2 GW. | |
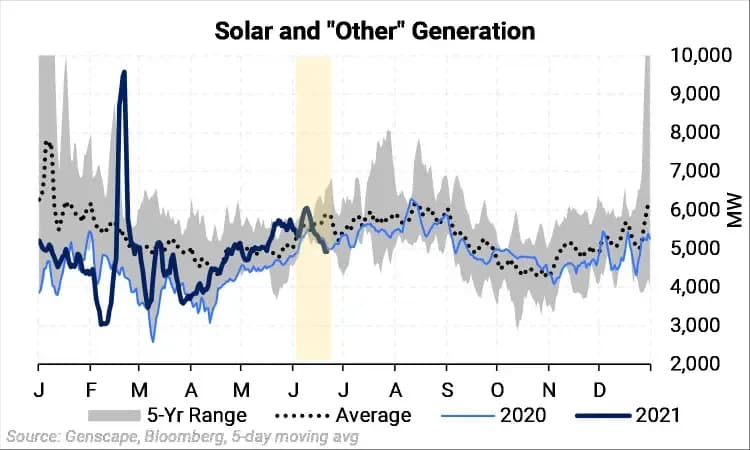
Solar was down around 1 GW for the highlighted period, but as the chart shows, solar accounts for a small piece of the overall power stack. |
Want this in your inbox?
AEGIS market analysts publish research across crude, natural gas, NGLs, refined products, metals, and rates.
Subscribe to research