Natural gas demand for power generation is lower, year over year
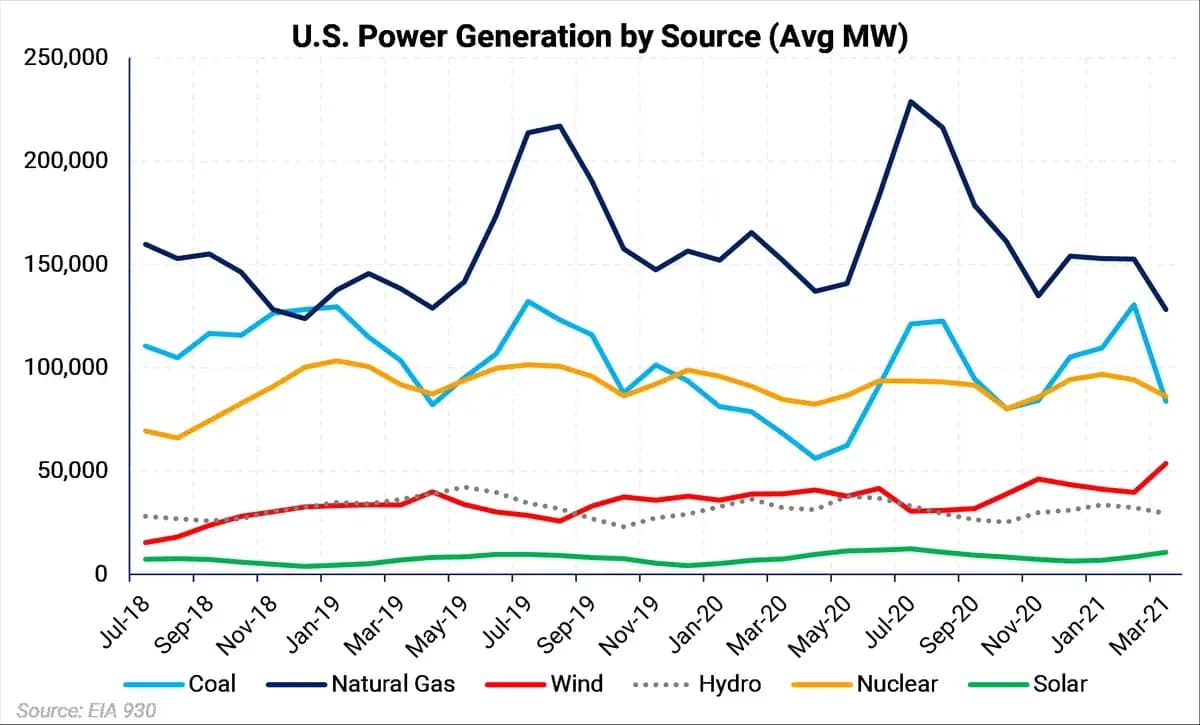
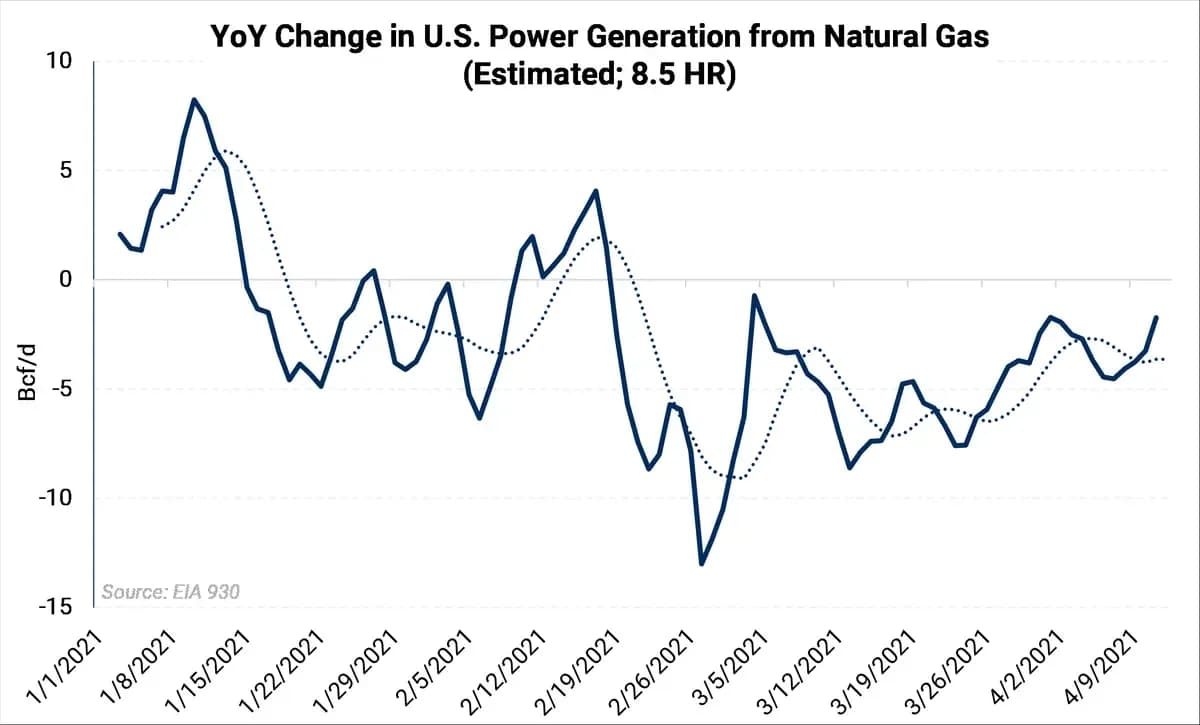
So far in 2021, total U.S. gas-fired power generation has been substantially lower than last year's, averaging -13,367 MW or an AEGIS-estimated -2.8 Bcf/d gas-unit equivalent. Gas-fired power generation was down by an average of 23,476 MW year-over-year during March, its largest year-over-year decline in at least the last two years.
The trend appears to have been exacerbated by Winter Storm Uri, which temporarily knocked nearly 22 Bcf/d of dry gas production offline in February (Bloomberg). Since the freeze, gas-fired power generation has failed to surpass 2020 generation levels a single time, even with higher load numbers, per EIA real-time data.
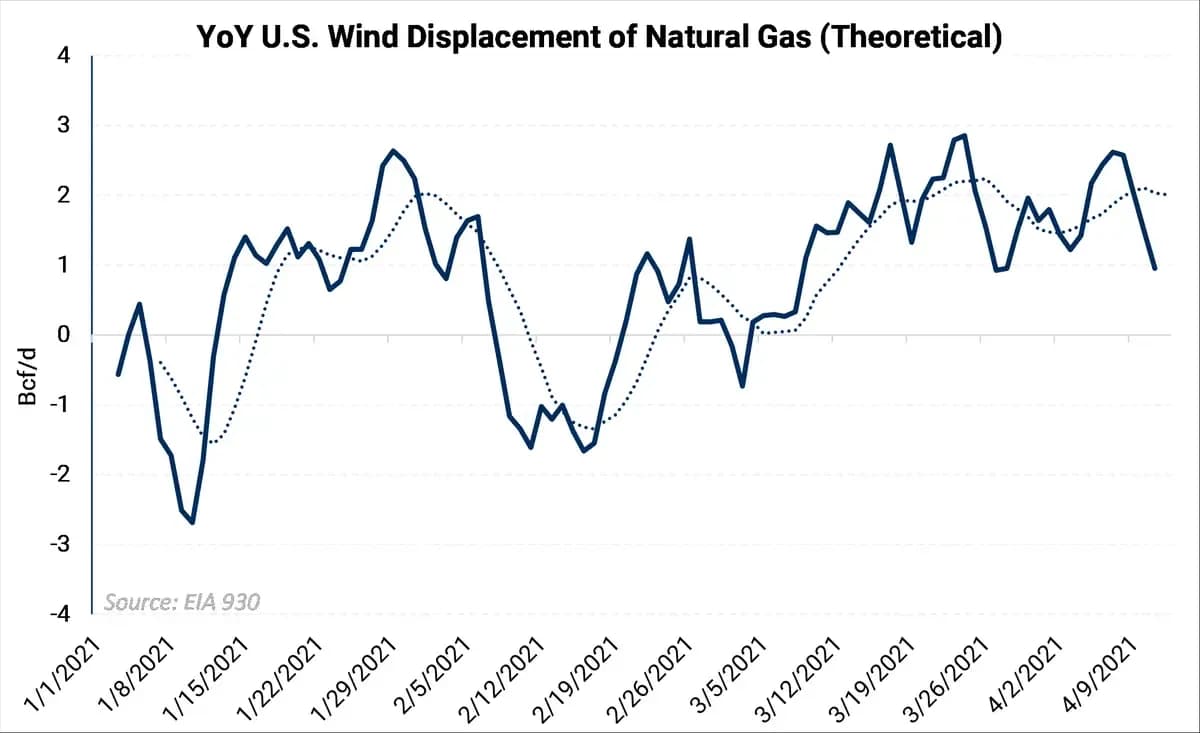
Wind generation averaged a new record-high of 50 GW in March, and may be displacing 2 Bcf/d of gas
In 2021, wind generation has been around 44,833 MW higher on average as more infrastructure was brought online in late 2020. Wind generation averaged over 50 GW in March, for a new record high.
Wind may have displaced 2 Bcf/d of gas recently. So far in 2021, the average theoretical wind displacement has been around 0.8 Bcf/d; though this number has increased recently, with the March average at approximately 1.3 Bcf/d of theoretical gas displacement.
The remaining gas demand losses are likely due to higher gas prices
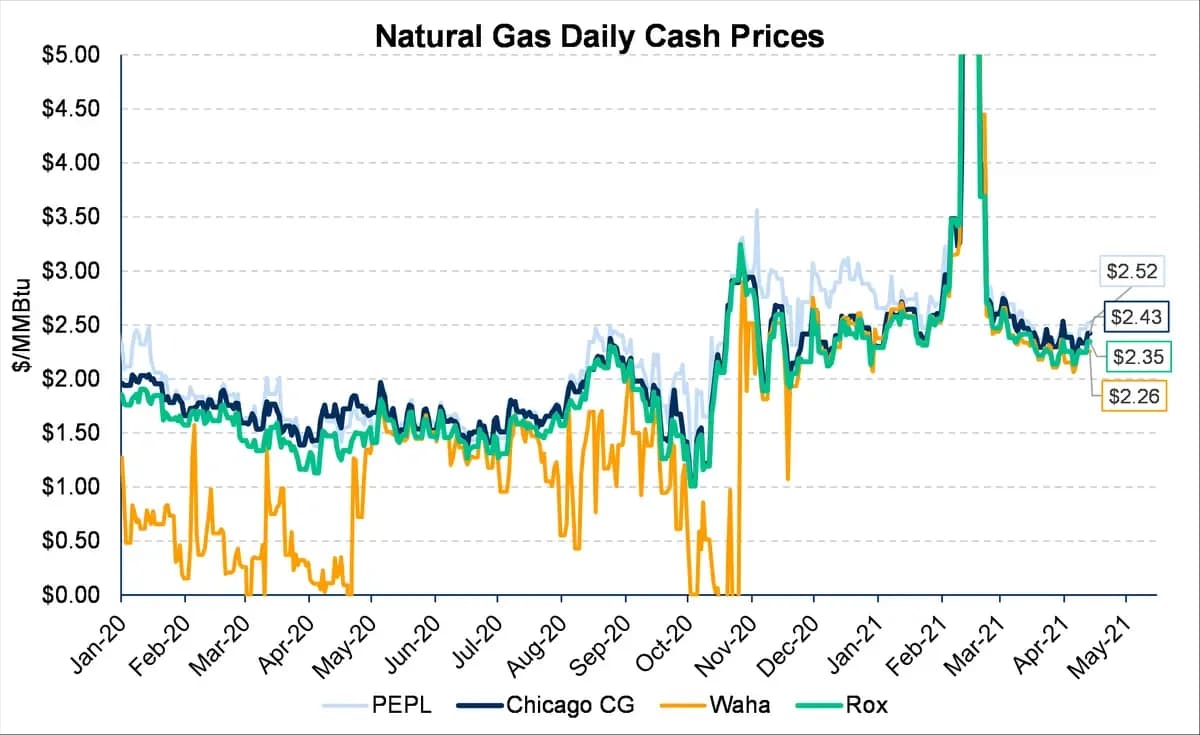
While wind is responsible for a portion of lost gas demand for power generation, higher gas prices are likely behind the drop as well. Daily cash gas prices are up significantly from where they were last year.
The chart below shows regional cash prices are up by nearly $1/MMBtu from where they were this time last year, and higher prices translate into less gas used for power generation in favor of cheaper alternatives, namely coal.
Power generation remained one of the bright spots for the gas market last summer. However, if prices stay at current levels, then the year-over-year declines in gas-fired power generation may continue. Henry Hub's Summer 2021 strip is currently trading at around $2.75/MMBtu, while the Summer 2020 strip settled at an average $2.074.