To quickly access the page content, please click on the links below:
News Update
- California gasoline demand remains weak. The state recorded fuel taxes on around 896,000 b/d of gasoline for June, a 1% decrease from May, a 5% drop from June 2021, and a 12% decline from the pre-pandemic June in 2019. The sluggish demand for the second quarter might add pressure to the state’s Low Carbon Fuel Standard, as the LCFS bank is growing since Q2 in 2021 and CARBOB generates around 80% of the LCFS deficit (2021 data).
- Airlines opposed to California’s push for more sustainable aviation fuel. Regulators in the state are seeking ways to increase demand for SAF, despite opposition from many in the aviation industry. SAF has been able to generate LCFS credits since 2019, but federal authorities prevent state regulation from shifting the composition of jet fuel, SAF must be as safe as conventional jet fuel. The California Air Resources Board is considering assigning penalties to petroleum jet fuel, although a trade association warned that doing so may be against federal regulations.
- The US ethanol industry could grow beyond “blend wall” The ethanol industry could see more growth with federal regulators looking to allow gasoline blends of 15% ethanol year-round. The recently passed Inflation Reduction Act could also support ethanol growth with its carbon capture and storage provisions that would allow ethanol producers to earn more tax credits. SAF made from ethanol could also become more attractive as a result of this legislation.
- LCFS price slump may not last, say suppliers. California LCFS credit prices have been declining and have recently fallen to their lowest level in six years. However, some producers believe this decline in price will only be temporary. World Energy chief executive Gene Gebolys said, “In the near term, lower LCFS values put pressure on margins, but they also provide proof that the system works” The reasons behind the drop in prices could be attributed to record supplies of unused credits and weak California gasoline consumption, which has fallen to pre-pandemic levels. As prices have come down state regulators have considered updating rules relating to LCFS. Graham Noyes, executive director of the Low Carbon Fuels Coalition said, "I think that the outcome of the California rulemaking will provide a correction that offsets the impact in the long term."
- Oregon EV charging company facing fine for fraudulent credits. The Oregon Department of Environmental Quality is accusing Thompson Technical Services of inflating LCFS credit generation. The company could be fined $2.7 million for selling $1.8 million worth of fraudulent credits. The state has not confirmed if this was the only such case of fraudulent credits being sold onto the market, although Oregon has started a third-party verification system to prevent cases of fraud linked to LCFS credits.
- Oregon raises LCFS targets. Oregon will be targeting a 20% decrease in transportation fuel carbon intensity by 2030, and a reduction of 37% by 2035. The proposal to raise targets also includes the expansion of credit generation to electric vehicles at airports. These new targets will represent the second-lowest carbon intensity limits of North American programs. The vote, however, does not affect the previous target of a 10% reduction by 2025, although a proposal to speed up reductions between 2025 and 2030 was offered.
Schedule
- January 2, 2023: California LCFS 3Q 2022 reporting deadline
- January 31, 2023: California LCFS 3Q 2022 data release
- April 3, 2023: California LCFS 4Q 2022 reporting deadline
- April 28, 2023: California LCFS 4Q 2022 data release
LCFS Credit Pricing
- Credits Price as of October 13th, 2022:
- California - Spot Delivery $67.00
- Oregon - Spot Delivery $117.00
LCFS Credit Transfer Activity for California
|
Time
|
Transfers
|
Total Volume
|
Avg $/credit
|
|
22-Sep
|
179
|
1,759,000
|
$102
|
|
22-Aug
|
153
|
1,624,000
|
$97
|
|
22- Jul
|
439
|
3,680,000
|
$117
|
|
22-Jun
|
133
|
1,268,000
|
$113
|
|
22-May
|
119
|
861,000
|
$125
|
|
22-Apr
|
468
|
4,584,000
|
$153
|
|
22-Mar
|
280
|
3,301,000
|
$158
|
|
22-Feb
|
159
|
1,550,000
|
$163
|
|
22-Jan
|
358
|
3,389,000
|
$167
|
|
21-Dec
|
269
|
3,217,000
|
$172
|
|
21-Nov
|
128
|
1,125,000
|
$174
|
|
21-Oct
|
434
|
3,782,000
|
$182
|
|
21-Sep
|
136
|
1,518,000
|
$183
|
|
21-Aug
|
100
|
709,000
|
$185
|
|
21-Jul
|
252
|
2,125,000
|
$188
|
|
21-Jun
|
190
|
1,873,000
|
$190
|
|
21-May
|
81
|
791,000
|
$190
|
|
21-Apr
|
345
|
3,455,000
|
$192
|
|
21-Mar
|
307
|
3,490,000
|
$198
|
|
21-Feb
|
87
|
1,019,000
|
$197
|
|
21-Jan
|
335
|
2,176,000
|
$199
|
|
20-Dec
|
260
|
2,997,000
|
$199
|
|
20-Nov
|
133
|
1,207,000
|
$196
|
|
20-Oct
|
336
|
2,237,000
|
$198
|
|
20-Sep
|
167
|
1,553,000
|
$196
|
|
20-Aug
|
111
|
857,000
|
$196
|
|
20-Jul
|
334
|
2,509,000
|
$199
|
|
20-Jun
|
129
|
1,059,000
|
$202
|
|
20-May
|
90
|
470,000
|
$195
|
|
20-Apr
|
344
|
4,098,000
|
$198
|
|
20-Mar
|
233
|
2,312,000
|
$199
|
|
20-Feb
|
84
|
581,000
|
$206
|
|
20-Jan
|
240
|
1,895,000
|
$200
|
|
19-Dec
|
217
|
2,216,000
|
$197
|
|
19-Nov
|
88
|
705,000
|
$195
|
|
19-Oct
|
243
|
1,990,000
|
$195
|
|
19-Sep
|
137
|
1,179,000
|
$195
|
|
19-Aug
|
89
|
929,000
|
$194
|
|
19-Jul
|
188
|
1,574,000
|
$193
|
|
19-Jun
|
114
|
875,000
|
$190
|
|
19-May
|
76
|
408,000
|
$185
|
|
19-Apr
|
131
|
1,299,000
|
$180
|
|
CY 2021
|
2,664
|
25,279,000
|
$187
|
|
CY 2020
|
2,461
|
21,728,000
|
$199
|
|
CY 2019
|
1,656
|
14,146,000
|
$192
|
|
CY 2018
|
1725
|
13,334,000
|
$160
|
|
CY 2017
|
1226
|
8,875,000
|
$89
|
|
CY 2016
|
929
|
5,343,000
|
$101
|
|
CY 2015
|
578
|
2,852,000
|
$62
|
|
CY 2014
|
304
|
1,667,000
|
$31
|
|
CY 2013
|
202
|
887,000
|
$55
|
|
CY 2012
|
24
|
164,000
|
$17
|
Source: https://ww2.arb.ca.gov/resources/documents/monthly-lcfs-credit-transfer-activity-reports
LCFS Cost for Gasoline and Diesel
- Cost as of October 13th, 2022 for Vintage 2022:
- California
- Carbob (No Cl ethanol)- Vintage 2022 8.34 cents per USG
- Carbob (79.9 Cl ethanol)- Vintage 2022 7.81 cents per USG
- Oregon
- E10 gasoline- Vintage 2022 6.80 cents per USG
- B5 diesel – Vintage 2022 7.73 cents per USG
Market Update
- On average, California LCFS traded at $77.31 in September, which was ~12% lower than the average of $88.15 in August and only ~3% higher than the 5-year low of $75 back in July 2017.
- The lowest reported trade AEGIS has seen was $62 for CA LCFS on September 30th. The market has rebounded to $68.50 as of October 14th.
- CARB reported 179 transactions in September, a 17% increase from 153 in August. The traded volume was equal to 1,759,000 credits compared to 1,642,000 credits in August, or an 8% increase. August's weighted-average price was $102, whereas the reported average spot price was 24% lower and equal to $77.31.
- October typically has more volume transacted than August and September, which will be interesting to see where the prices end up by end of October given the larger volume coming to this market.
- Regulators continue considering practices that could tighten the supply-demand balance of LCFS credits due to the continuous decline in price driven by oversupply.
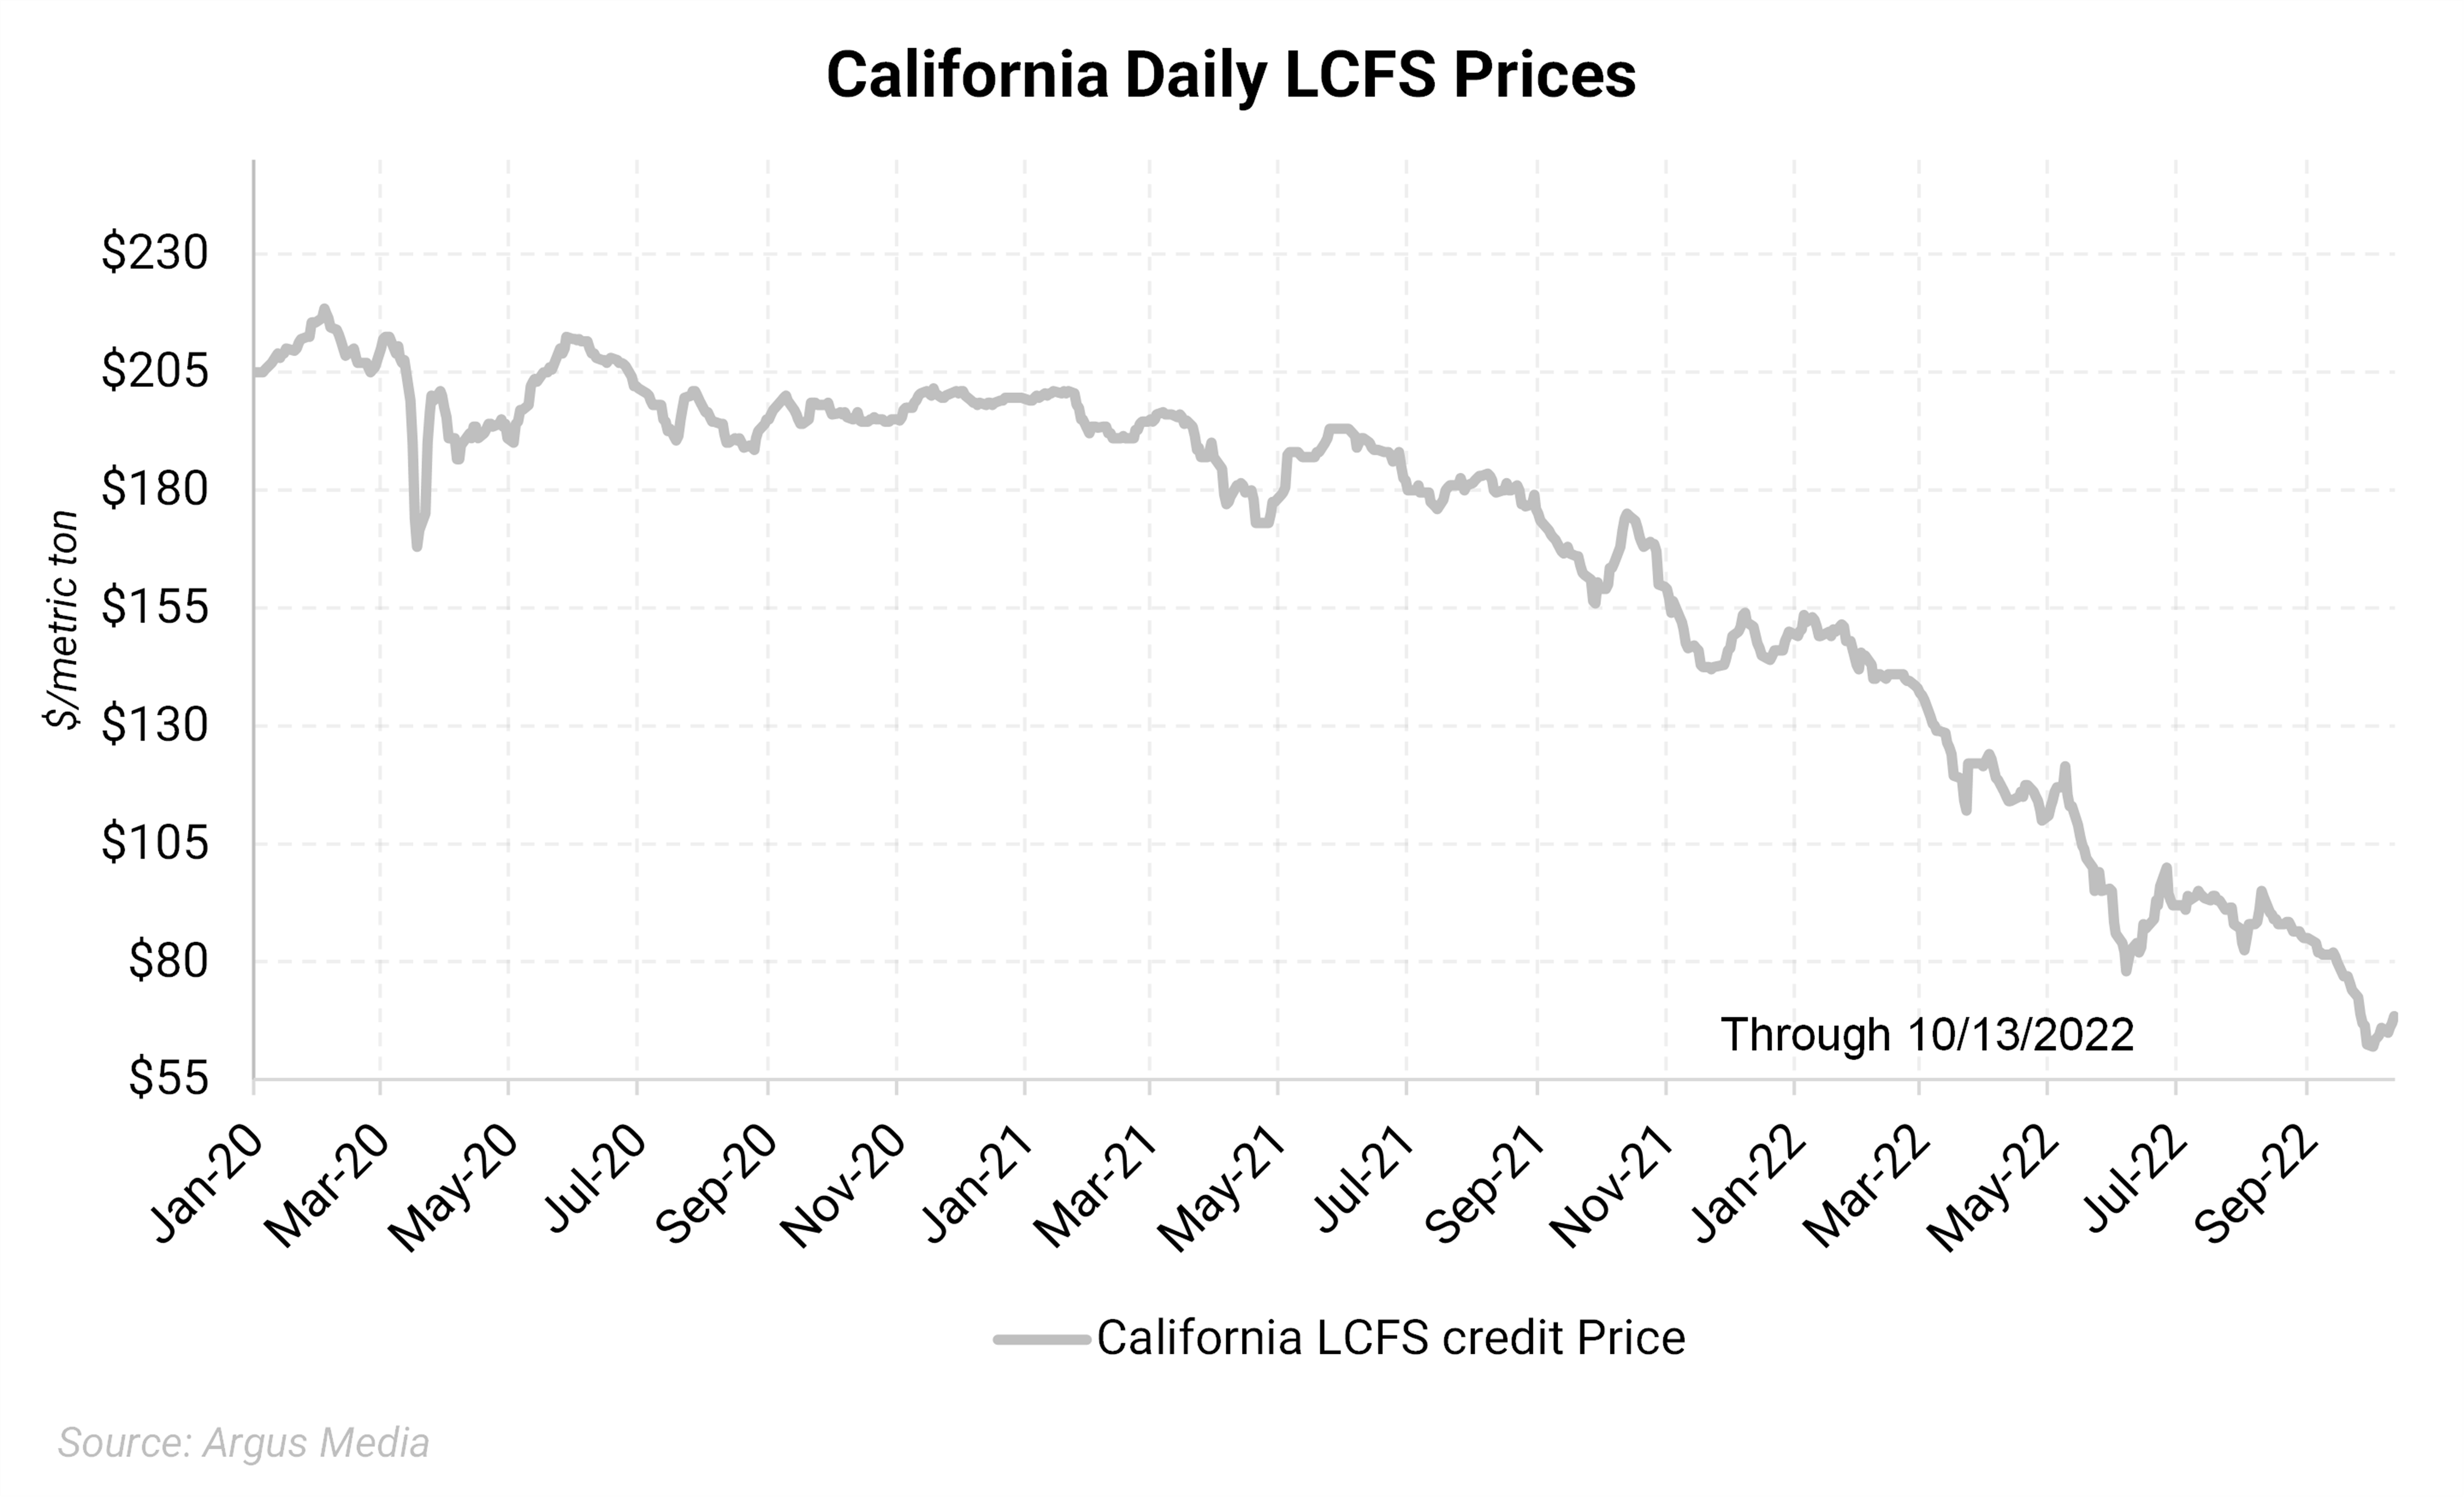
Figure 1. California LCFS USD/mt Jan. 2020 - Present
 |
| |
2021 Average Daily Price: $176.53 2022 Average Daily Price: $107.91
2021 Highest Daily Price: $201.00 2022 Highest Daily Price: $153.50 (1/6/2022) |
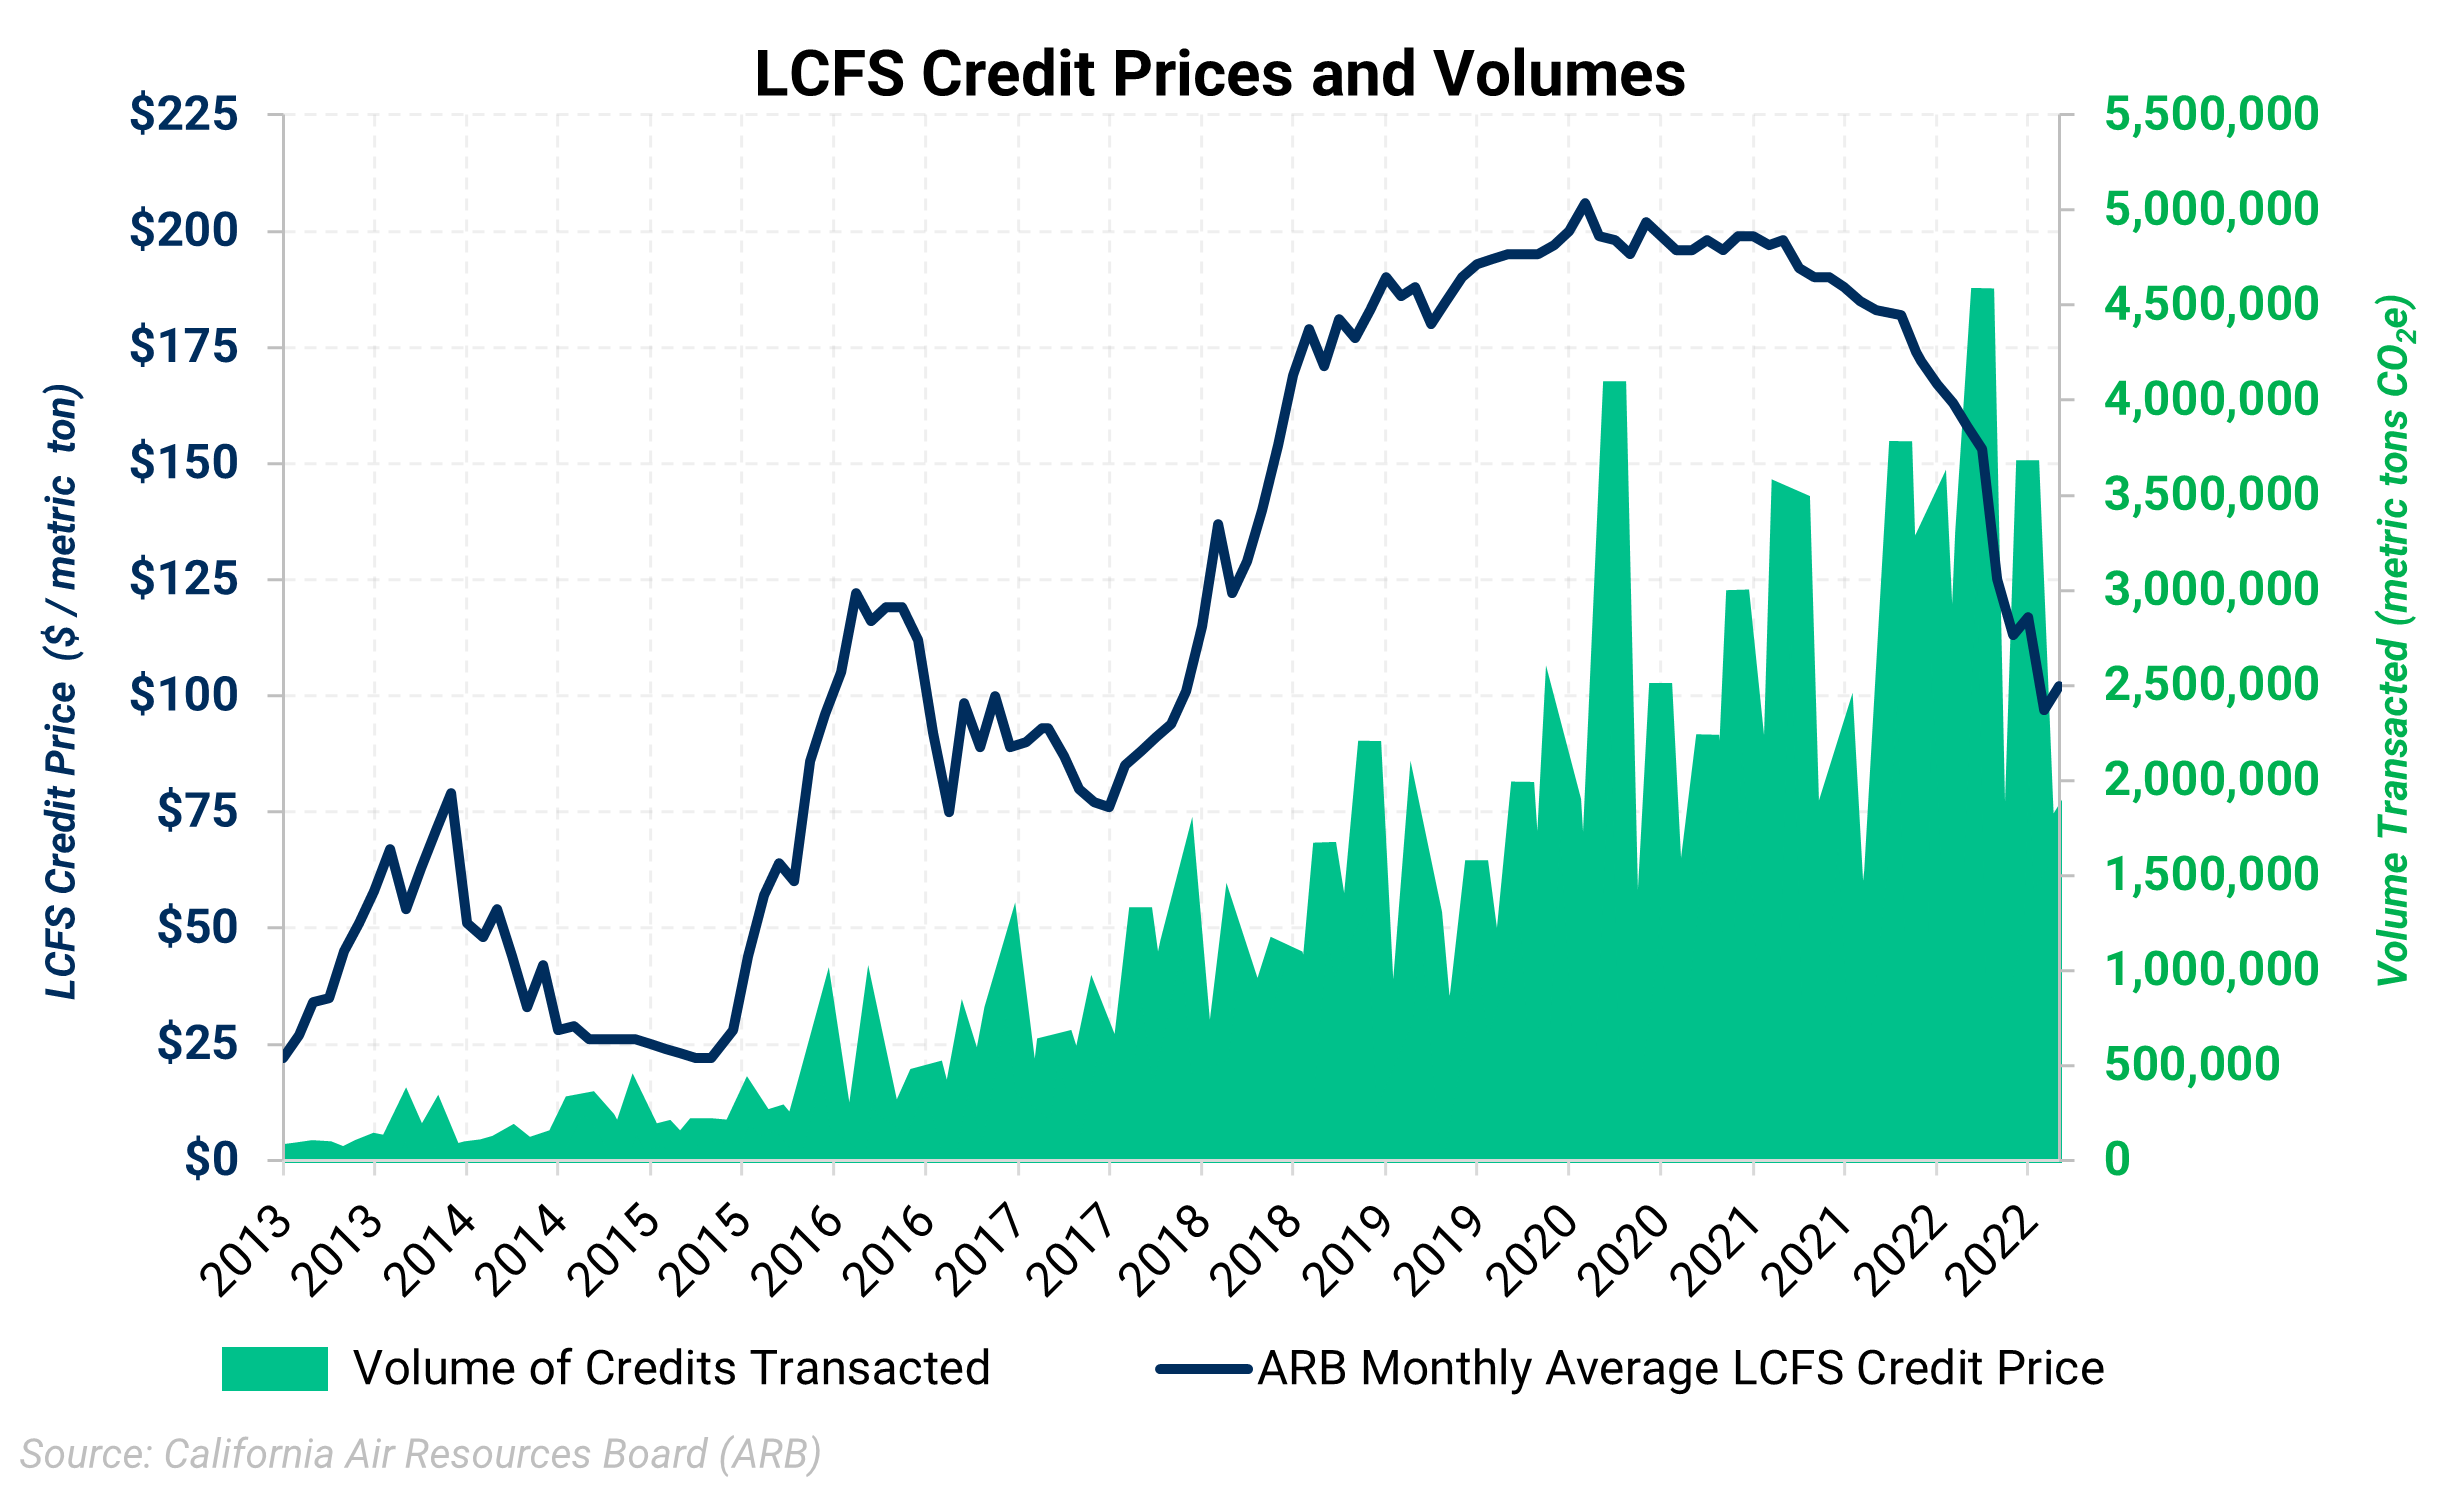
Figure 2. California Monthly LCFS Credit Price and Transaction Volume as Reported by ARB
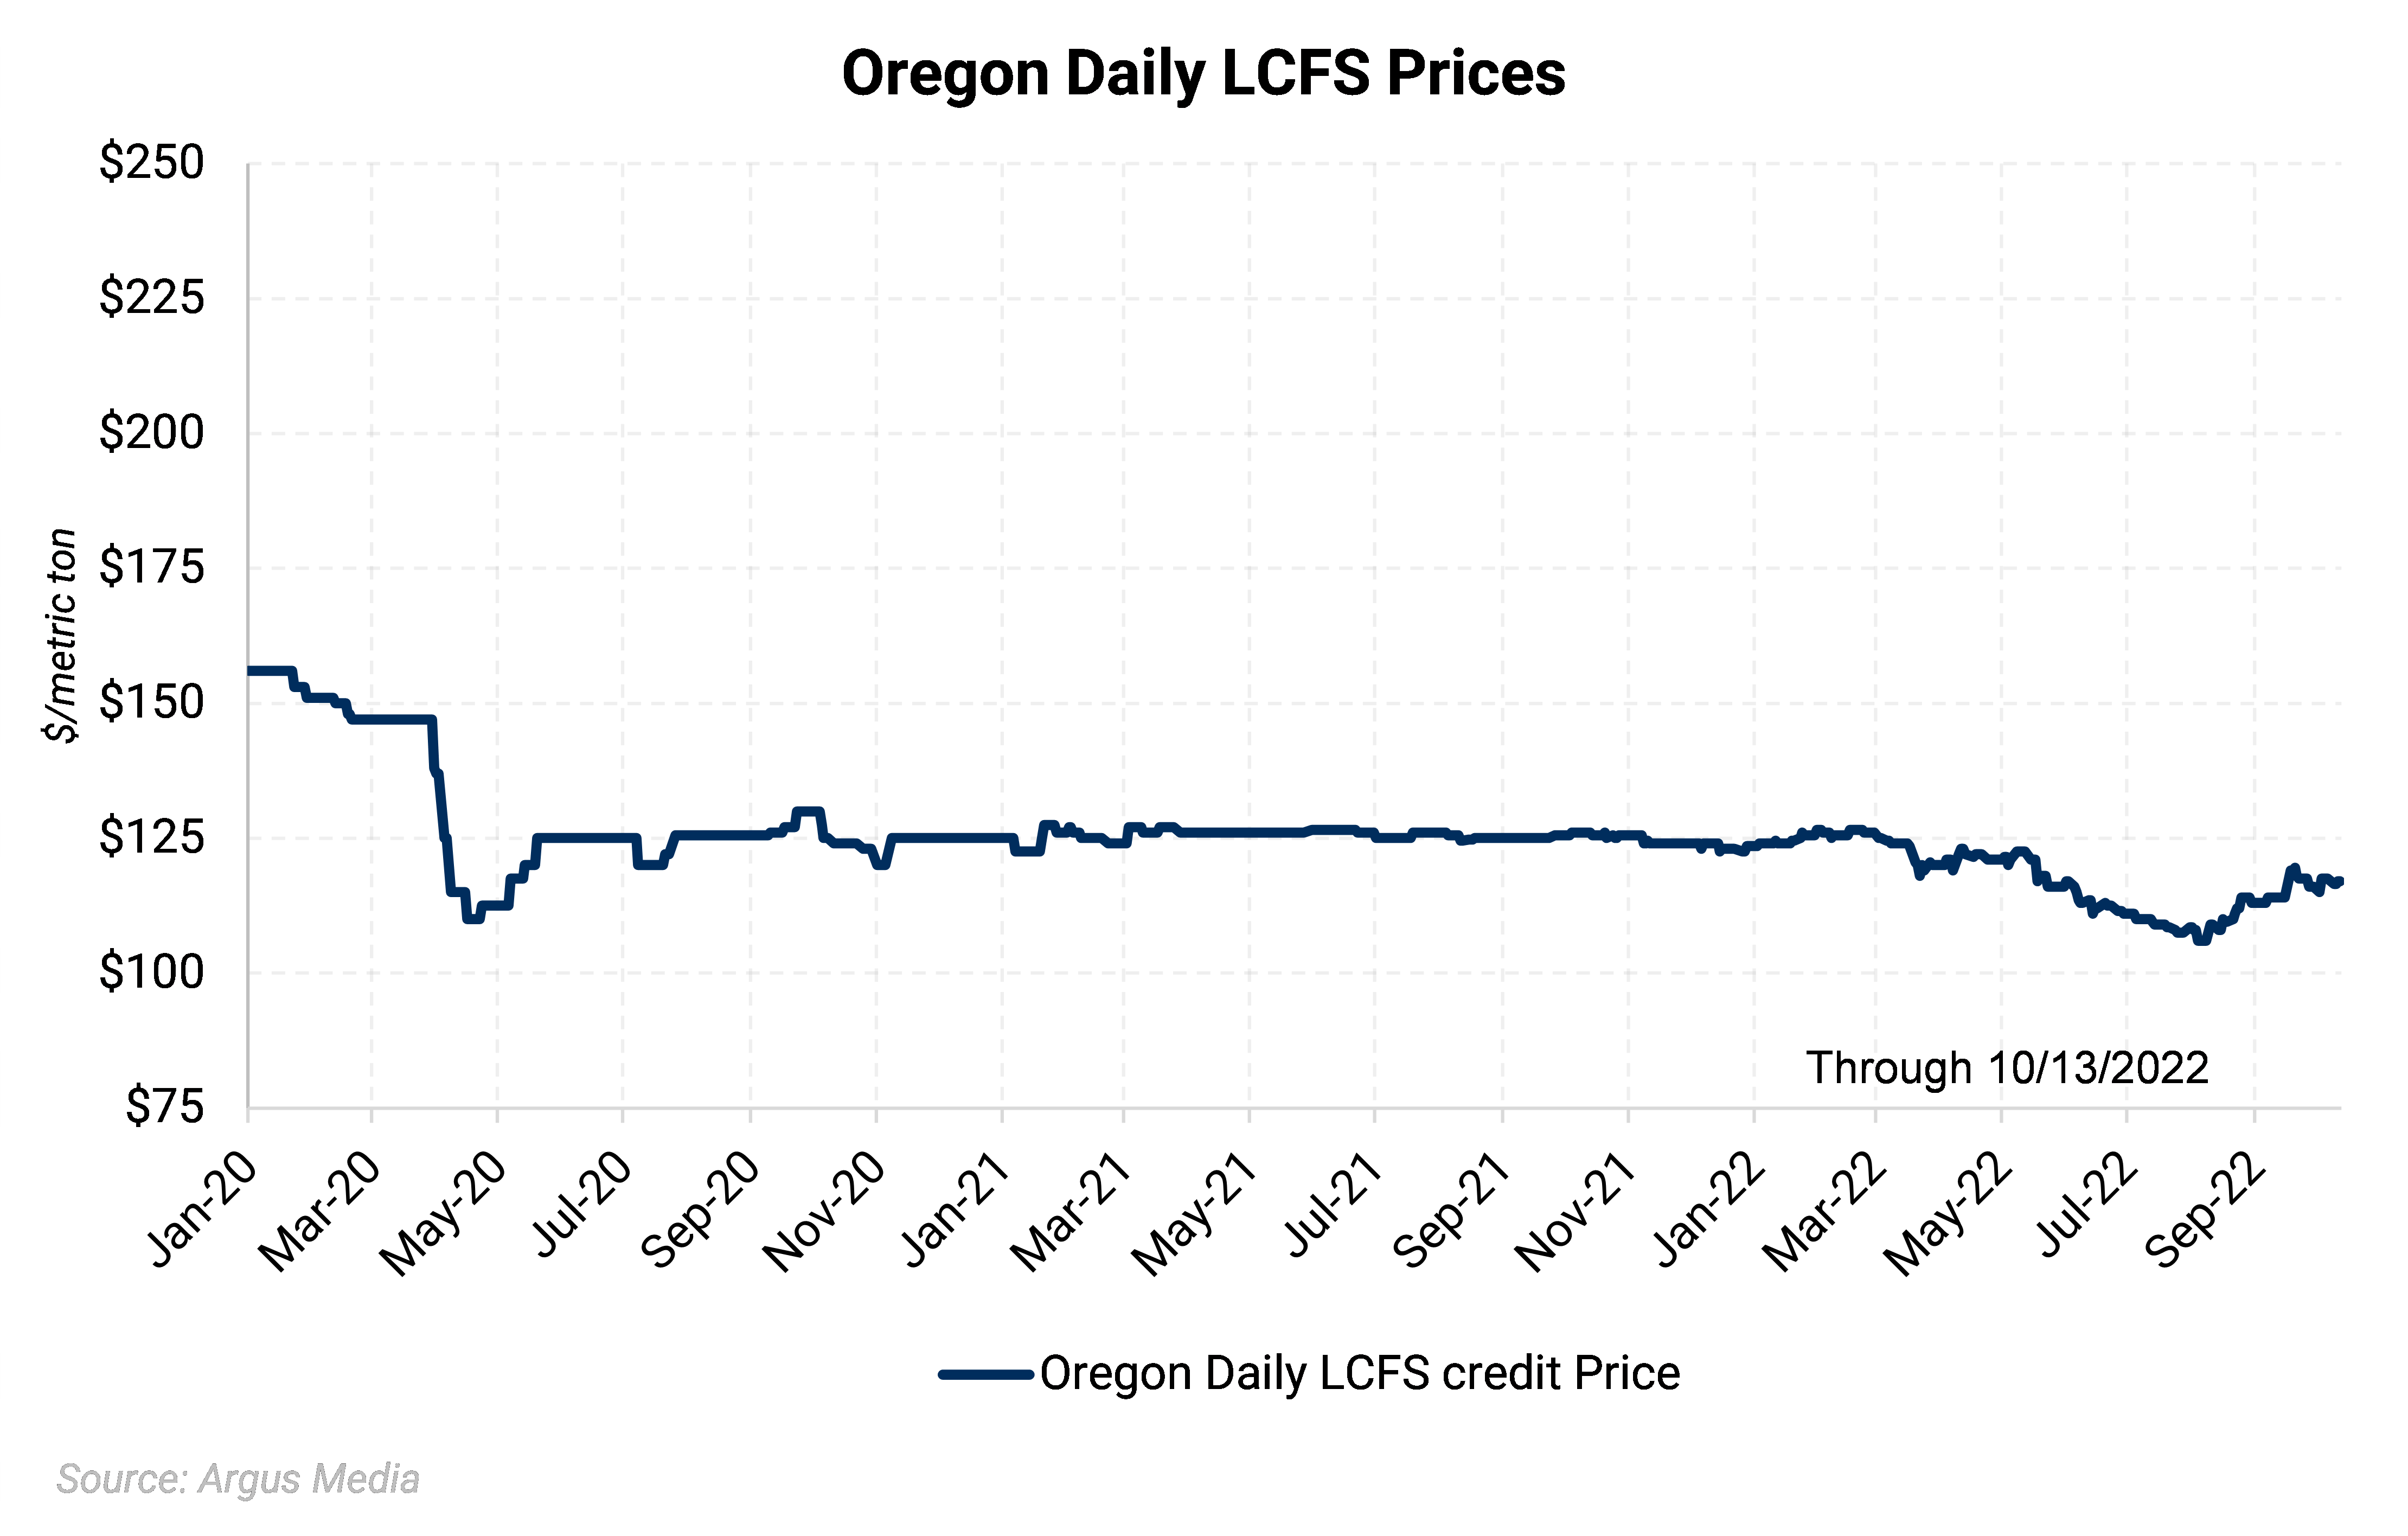
Figure 3. Oregon LCFS USD/mt Jan. 2020 – Present
|
|
|
|
|
2021 Average Daily Price: $125.32
|
2022 Average Daily Price: $117.74
|
|
2021 Highest Daily Price: $127.50
|
2022 Highest Daily Price: $126.50
|
Questions? Contact our team for more information: environmental@aegis-hedging.com
CONFIDENTIAL – UNAUTHORIZED THIRD-PARTY DISTRIBUTION PROHIBITED